Bollinger Bands "The Best Sideways Indicator" 📈
⚠️ This article is for educational purposes only and not intended as financial advice.
Extracting Data From Binance.US
We need to create an account somewhere that will allow us API access to the data we need to feed to our python program. It’s been awhile since I’ve used a centralized exchange so let’s walk through this process together.
Let’s register with the United States based Binance.US exchange. Once you’ve completed the registration. Navigate to the API Management page. Follow the prompts until you’ve been presented with your API key and Secret Key. You’ll likely want to keep these safeguarded in a password database like KeyPassXC.
Directory Structure
Create the following directory structure.
crypto/
├─ analysis/
│  ├─ __init__.py
│  └─ bollinger.py
├─ binance/
│  ├─ __init__.py
│  ├─ api.py
│  ├─ binance.py
│  └─ market.py
└─ main.py
Exploring The Binance.US API
crypto/
└─ binance/
   └─ api.py
       Ⓒ BinanceAPI()
          Ⓢ error_handler()
          Ⓢ deserialize()
We will be making heavy use of the Binance.US API Documentation.
- The base endpoint is: https://api.binance.us
- All endpoints return either a JSON object or array.
- Data is returned in ascending order. Oldest first, newest last.
- All time and timestamp related fields are in milliseconds.
from requests.exceptions import HTTPError
from functools           import wraps

class BinanceAPI:

    API_KEY    = "YOUR API KEY GOES HERE"
    API_SECRET = "YOUR API SECERT GOES HERE"
    HEADER     = {
        'get' : {"X-MBX-APIKEY": API_KEY},
    }

    # Base + Version
    __baseEndpoint = 'https://api.binance.us'
    ENDPOINT       = __baseEndpoint + '/api/v3/'

    @staticmethod
    def error_handler(func):
        @wraps(func)
        def logic(*args, **kwargs):
            resp = func(*args, **kwargs)

            if not resp.ok:
                raise HTTPError(f"[!] Error: {resp.status_code} {resp.reason} {resp.json()}")

            if resp.status_code != 200:
                print(f"[!] Warning: {resp.status_code} {resp.reason}")

            return resp
        return logic

    @staticmethod
    def deserialize(func):
        @wraps(func)
        def transform(*args, **kwargs):
            try:
                resp = func(*args, **kwargs)
            except HTTPError as error:
                print(error)
                return False

            return resp.json()
        return transform
The BinanceAPI Method Decorators
The @error_handler decorator is a simple function that tests the response object for an HTTP status code of 400 or higher, indicated by the negation of resp.ok. If this is triggered the decorator will raise requests.exception.HTTPError with the response objects textual reason as the error. You can expand this on your own with resp.status_code.
@staticmethod
def error_handler(func):
    @wraps(func)
    def logic(*args, **kwargs):
        resp = func(*args, **kwargs)

        if not resp.ok:
            raise HTTPError(f"[!] Error: {resp.status_code} {resp.reason} {resp.json()}")

        if resp.status_code != 200:
            print(f"[!] Warning: {resp.status_code} {resp.reason}")

        return resp
    return logic
The final decorator we will be making use of is our deserializer. Essentially this function will handle the result of the previous decorator as we will be stacking these decorators over the various class methods. If the @error_handler decorator raises an exception, the try except block will be executed, returning False. If all goes as planned, the requests response object is passed into the @deserialize decorator, which will take an stringified json object from the server and “deserialize” it into a dictionary object manipulatable by our program.
@staticmethod
def deserialize(func):
    @wraps(func)
    def transform(*args, **kwargs):
        try:
            resp = func(*args, **kwargs)
        except HTTPError as error:
            print(error)
            return False

        return resp.json()
    return transform
Extracting Candlestick Data
crypto/
└─ binance/
   └─ market.py
        Ⓒ MarketData(BinanceAPI)
            Ⓜ klines()
The primary role this class plays is that of the retrieval of actionable data from the Binance.US REST server. Through inheritance of its parent BinanceAPI class, each method’s returned data will be deserialized into useable data structures for use in our bot.
- For GET endpoints, parameters must be sent as a query string.
- Candlestick Kline Documentation
from binance.api import BinanceAPI

import requests

class MarketData(BinanceAPI):

    @BinanceAPI.deserialize
    @BinanceAPI.error_handler
    def ping(self):
        """
        GET /api/v3/ping

        Test connectivity to the Rest API.

        Weight: 1

        Parameters: NONE

        Response: {}
        """
        return requests.get(url = BinanceAPI.ENDPOINT + 'ping')

    @BinanceAPI.deserialize
    @BinanceAPI.error_handler
    def klines(self, symbol="BTCUSDT", interval="1d", startTime=None, endTime=None, limit=500):
        """
        GET /api/v3/klines

        Kline/candlestick bars for a symbol.
        Klines are uniquely identified by their open time.

        Weight: 1

        | Name      | Type   | Mandatory | Description             |
        |-----------|--------|-----------|-------------------------|
        | symbol    | STRING | YES       |                         |
        | interval  | ENUM   | YES       |                         |
        | startTime | LONG   | NO        |                         |
        | endTime   | LONG   | NO        |                         |
        | limit     | INT    | NO        | Default: 500; max 1000. |

        If startTime and endTime are not sent, the most recent klines are returned.

        Response:

        [
            [
                1499040000000, // Open time
                "0.00386200",  // Open
                "0.00386200",  // High
                "0.00386200",  // Low
                "0.00386200",  // Close
                "0.47000000",  // Volume
                1499644799999, // Close time
                "0.00181514",  // Quote asset volume
                1,             // Number of trades
                "0.47000000",  // Taker buy base asset volume
                "0.00181514",  // Taker buy quote asset volume
                "0" // Ignore.
            ]
        ]

        m -> minutes; h -> hours; d -> days; w -> weeks; M -> months
        """
        return requests.get(
            url     = BinanceAPI.ENDPOINT + 'klines',
            params  = {
                'symbol'    : symbol,
                'interval'  : interval,
                'startTime' : startTime,
                'endTime'   : endTime,
                'limit'     : limit
            }
        )
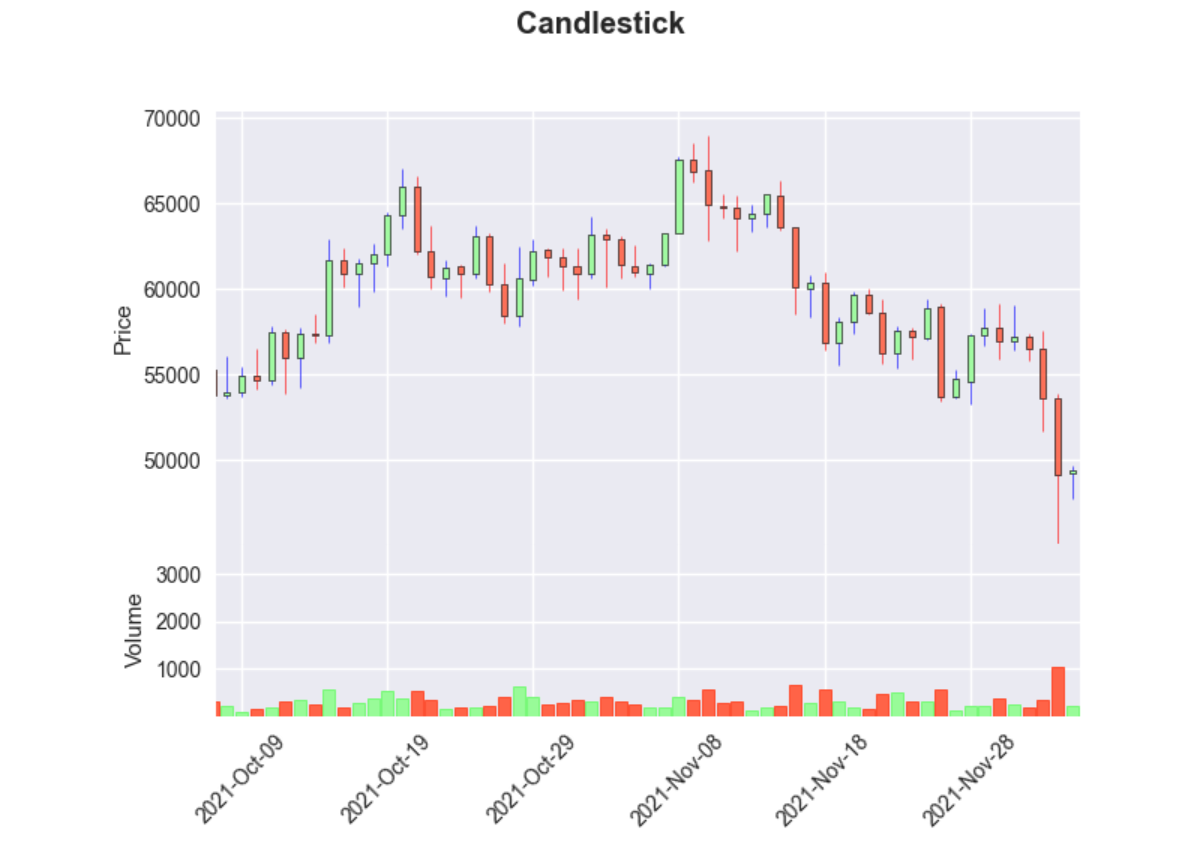
Formatting Candlestick Data
crypto/
└─ binance/
    └─ binance.py
        Ⓒ Binance(MarketData)
            Ⓜ candles()
        Ⓓ say()
from binance.market import MarketData
from datetime       import datetime

import numpy  as np
import pandas as pd

import time

class Binance(MarketData):
    """
    The purpose of this class is to make sense of the data provided by its inherited methods.
    """

    def test_connection(self):
        return self.ping()

    def candles(self, symbol="BTCUSDT", interval="1d", startTime=None, endTime=None, limit=500):
        """
        Returns kline data in a pandas DataFrame.

                                    open      high       low     close      volume
        date
        2022-01-07 23:59:59.999  41813.06  42003.24  41763.62  41877.37    3.722429
        2022-01-08 03:59:59.999  41953.26  42199.05  41775.61  41936.91   16.839122
        2022-01-08 07:59:59.999  41932.70  42044.44  41395.90  41610.62   34.417348
        2022-01-08 11:59:59.999  41616.50  41724.13  40502.75  40802.00   74.394267
        2022-01-08 15:59:59.999  40871.32  42318.07  40726.98  41691.66   37.362512
        ...                           ...       ...       ...       ...         ...
        2022-01-21 03:59:59.999  39120.92  39279.94  38682.95  38880.04   25.458106
        2022-01-21 07:59:59.999  38903.98  39030.43  37706.69  38849.32  121.282145
        2022-01-21 11:59:59.999  38866.64  39057.23  37857.95  37954.55  115.010300
        2022-01-21 15:59:59.999  37967.73  38508.49  35450.11  36474.82  350.844053
        2022-01-21 19:59:59.999  36445.31  36832.05  36157.48  36368.72   52.074380

        [84 rows x 5 columns]
        """

        data    = self.klines( symbol, interval, startTime, endTime, limit )
        dateObj = lambda x: datetime.fromtimestamp(x/1000)

        df = pd.DataFrame(
            # Open / High / Low / Close / Volume / Datetime Object
            data    = [ [dateObj(i[6])] + i[1:6] for i in data ],
            columns = ['date', 'open', 'high', 'low', 'close', 'volume'],
            dtype   = np.double
        )
        df.set_index('date', inplace=True)

        return df

def say(string):
    t = time.strftime("%Y%m%d %I:%M:%S", time.localtime())
    print(f"[{t}] {string.title()} ...")
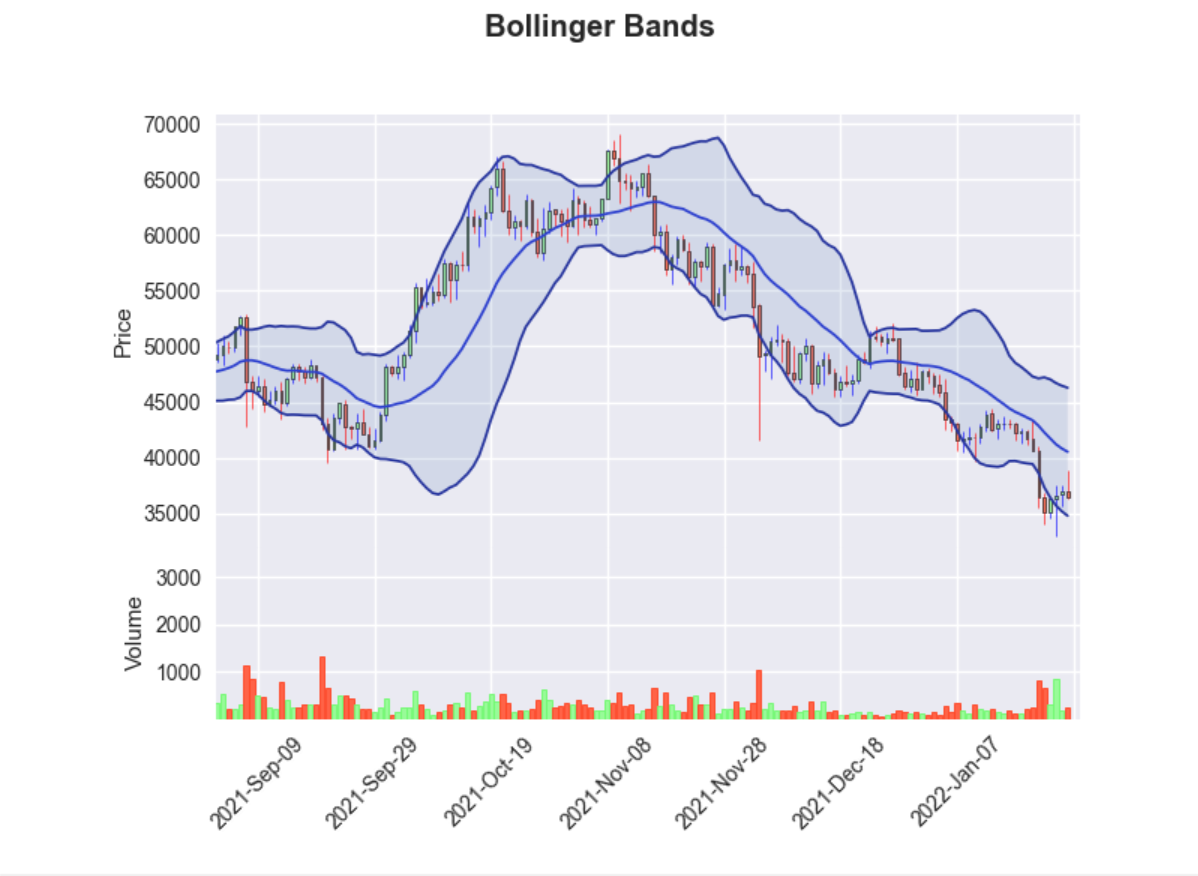
Plotting Technical Indicators
Bollinger Bands
crypto/
└─ analysis/
   └─ bollinger.py
        Ⓒ BollingerBands
            Ⓜ bbands()
            Ⓜ plot()
Bollinger Bands (A.K.A The Best Sideways Indicator) are best utilized when the market is clearly trend less and consolidating sideways. In these instances, we turn to Bollinger Bands and Chart Patterns. This section will describe how the BBands indicator works.
| 20 (Default) | Used with 1D timeframe on legacy 5/d week markets, or 20 days a month |
| 30 | More appropriate for bitcoin and 24/7 crypto markets, 30 days in a month |
| 14 | Captures two weeks of data, or 14 days, on the 1D timeframe. Appropriate for some market conditions where a faster signal is needed |
Entry Signal: When the price consolidates, and the BBands tighten, a break above or below the bands constitutes a BBand breakout. There is often a fake out break out of bands in the opposite direction and for this reason, BBands should not be used alone for trading decisions.- When the bands tighten during a period of low volatility, it raises the likelihood of a sharp price move in either direction. This may begin a trending move. Watch out for a false move in opposite direction which reverses before the proper trend begins.
| Volatility | When the bands separate by an unusual large amount, volatility increases and any existing trend may be ending. |
| Edge-to-Edge | Prices have a tendency to bounce within the bands’ envelope, touching one band then moving to the other band. You can use these swings to help identify potential profit targets. For example, if a price bounces off the lower band and then crosses above the moving average, the upper band then becomes the profit target. |
| Walking The Bands | Can occur to represent strong bullish or bearish continuation, often a leading indicator of price action to come |
| Price can exceed or hug a band envelope for prolonged periods during strong trends. On divergence with a momentum oscillator, you may want to do additional research to determine if taking additional profits is appropriate for you. | |
| A strong trend continuation can be expected when the price moves out of the bands. However, if prices move immediately back inside the band, then the suggested strength is negated. |
import mplfinance as mpf

class BollingerBands:

    def bbands(self, df, window=20):
        tp  = (df['high'] + df['low'] + df['close'])/3
        sma = tp.rolling(window).mean()
        std = tp.rolling(window).std()
        up  = sma + (std*2)
        dn  = sma - (std*2)

        return sma, up, dn

    def plot(self, df, window=20):
        sma, up, dn = self.bbands(df, window)

        apds = [
            mpf.make_addplot(sma, panel=0, type='line', ylabel=f"sma"  , color='#2d40ce'),
            mpf.make_addplot(up , panel=0, type='line', ylabel=f"upper", color='#27359e'),
            mpf.make_addplot(dn , panel=0, type='line', ylabel=f"lower", color='#27359e')
        ]

        # CUSTOM STYLE
        stylish = mpf.make_mpf_style(
            marketcolors = mpf.make_marketcolors(
                up     = 'palegreen',
                down   = 'tomato',
                wick   = {'up':'blue','down':'red'},
                volume = 'in'
            ),
            base_mpl_style="seaborn"
        )

        mpf.plot(
            df,
            type         = 'candle',
            fill_between = dict(
                y1    = up.values,
                y2    = dn.values,
                alpha = 0.15
            ),
            volume       = True,
            addplot      = apds,
            style        = stylish,
            title        = 'Bollinger Bands'
        )
The Main Program
crypto/
└─ main.py
from binance.binance    import Binance, say
from analysis.bollinger import BollingerBands

TICKER = "BTCUSDT"

def main():
    # Initialize Class Instance to Handle
    say("initializing binance class instance")
    bi = Binance()

    # Retrieve candlestick data for fractal calculations
    say("retrieving candlestick data")
    df = bi.candles(
        symbol    = TICKER,
        interval  = '1d',
    )

    if bi.test_connection():
        raise ConnectionError("[!] Connect to the internet!".title())

    say("connectivity established")

    say("plotting bollinger bands")
    bbs = BollingerBands()
    bbs.plot(df, 14)

if __name__ == "__main__":
    main()