GUI Programming With PySide6 💻 & PyQtGraph 📈
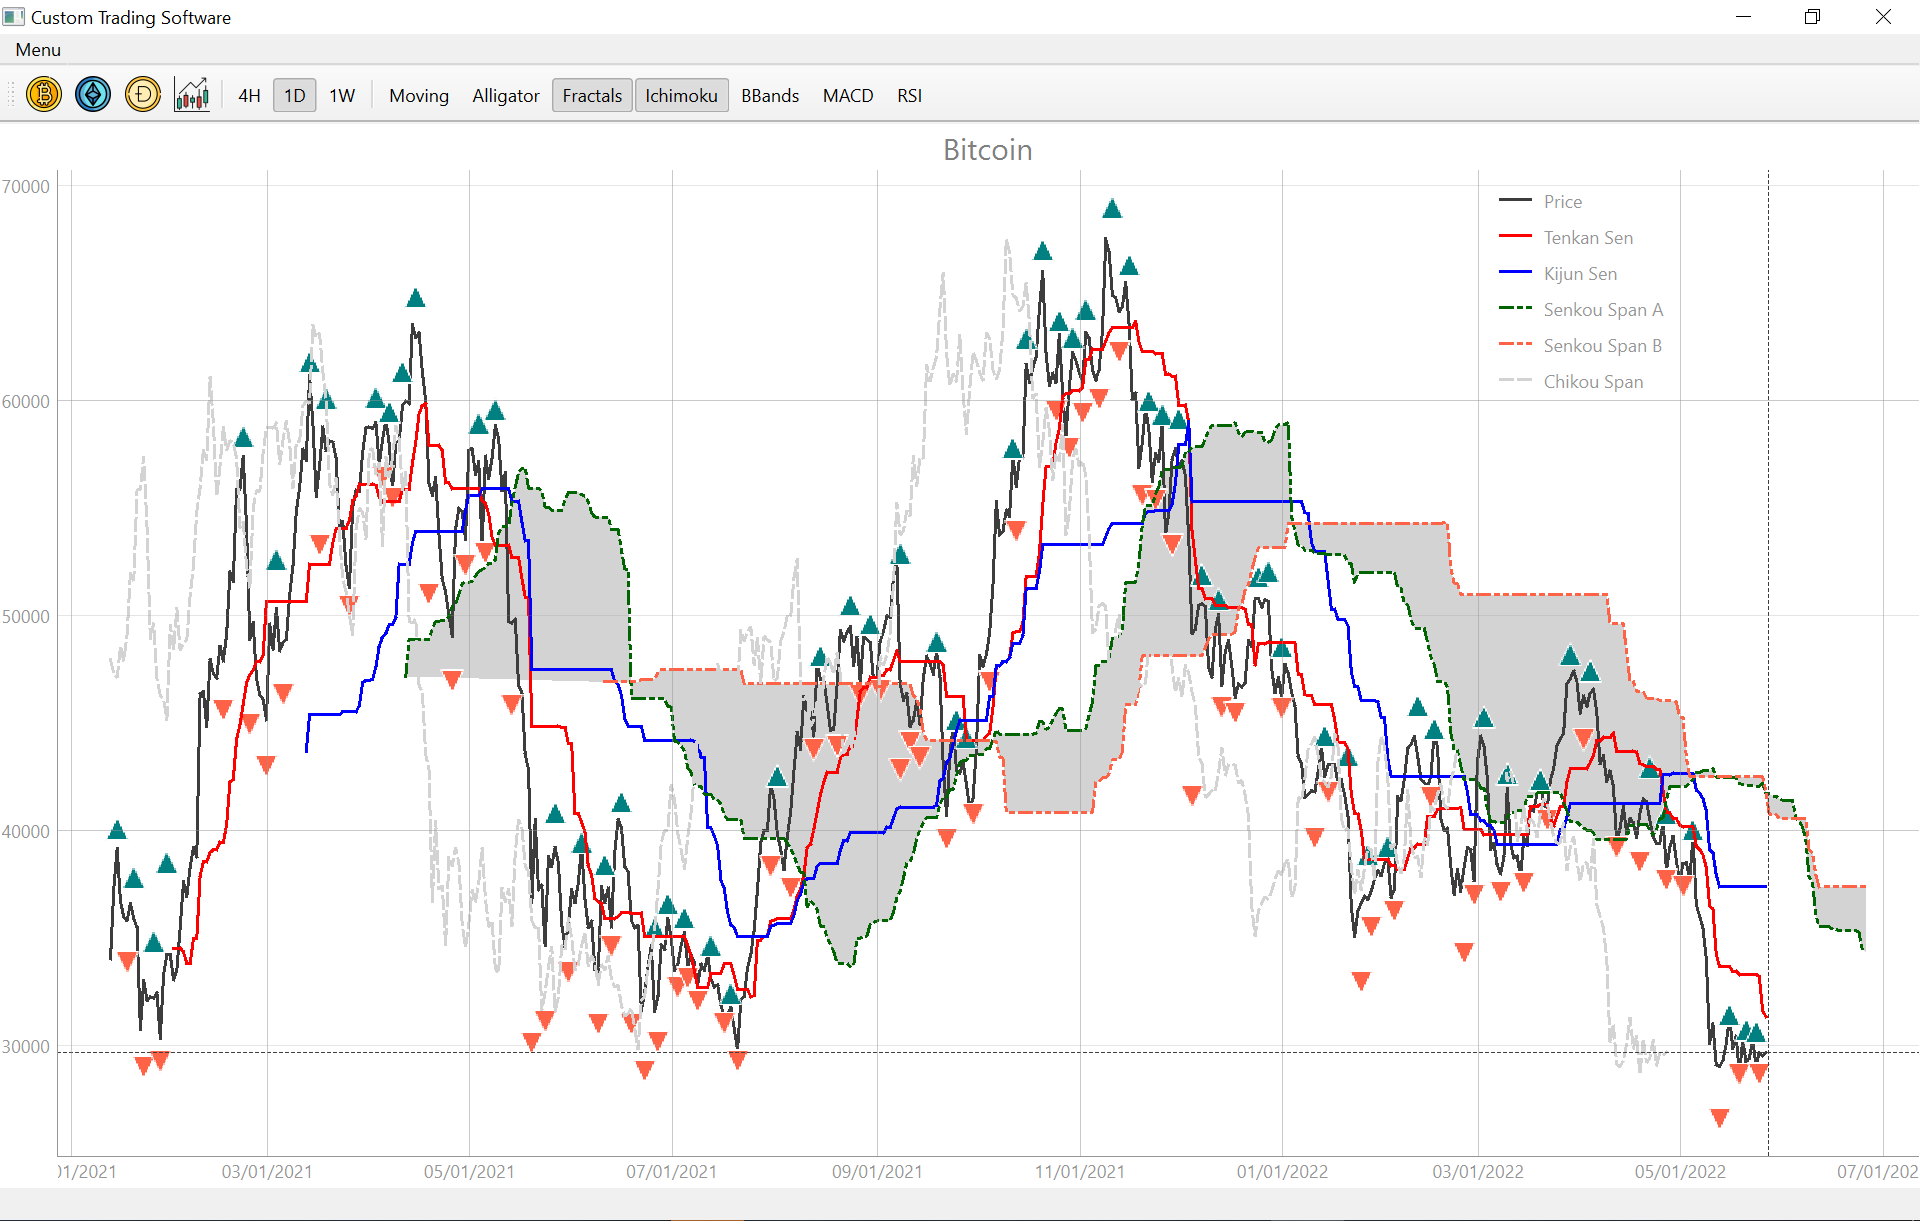 The picture above shows bitcoin’s close price plotted with Ichimoku Cloud & William’s Fractals. 20 / 60 / 120 / 30 / 30 are the recommended settings for Ichimoku cloud when applied to Bitcoin.
After toying with PySide6 for a little while, I think it’s safe to say that Qt has become my favorite GUI toolkit over wxPython for programming graphical user interfaces in Python.
While matplotlib/mplfinance is superior for the visualization and analysis of financial data. I thought I’d try PyQTGraph out for this article to demonstrate the embedding of custom widgets in Qt designer.
GUI Programming With PySide6
Setup
The way I’ve set this up is in a virtual environment so open up the command line and change directory to your desktop and create the virtual environment in a folder called ‘virtual’ on your desktop. The next step is to change directory to the Scripts folder and activate the environment. Before we install any packages make sure pip is up to date and then install pyside6, pandas, and requests.
cd Desktop && python -m venv virtualcd C:\Users\%USERNAME%\Desktop\virtual\Scripts && activatepython.exe -m pip install --upgrade pippip install pyside6 pandas requests pyqtgraph
Change directory back to the root of the virtual environment and create a folder called Projects, this is where we will create new projects in this environment. We can now create the root of our first directory by creating a folder called crypto within Projects.
cd C:\Users\%USERNAME%\Desktop\virtual && md Projectscd Projects && md crypto && cd crypto
First Steps
| QApplication | QMainWindow | QPushButton |
Create a file called main.py and paste the following code within (I use VSCode & Notepad++ to edit code). You can then run the code in the command line console with the command python main.py. You should get a small window with a button you can click to get a “Clicked!” message. When the button is clicked, QPushButton sends a signal to our button_clicked slot and executes the code there.
import sys
#  QApplication is the application handler
#  QWidget is a simple and empty GUI widget
from PySide6.QtWidgets import QApplication, QMainWindow, QPushButton

def main():
    # Passing in sys.argv enables command line arguments
    app = QApplication(sys.argv)

    # Create main window
    window = MainWindow()

    # Windows are hidden by default
    window.show()

    # Start event loop
    app.exec()

class MainWindow(QMainWindow):
    def __init__(self):
        super().__init__()

        # Set a custom window title
        self.setWindowTitle("Hello")

        # Create button widget
        button = QPushButton("Click")

        # Connect QPushButton Signal to custom slot
        button.clicked.connect(self.button_clicked)

        # Set the central window
        self.setCentralWidget(button)

    # Create custom slot to accept QPushButton clicked signal
    def button_clicked(self):
        print("Clicked!")

if __name__ == "__main__":
    main()
Qt Designer
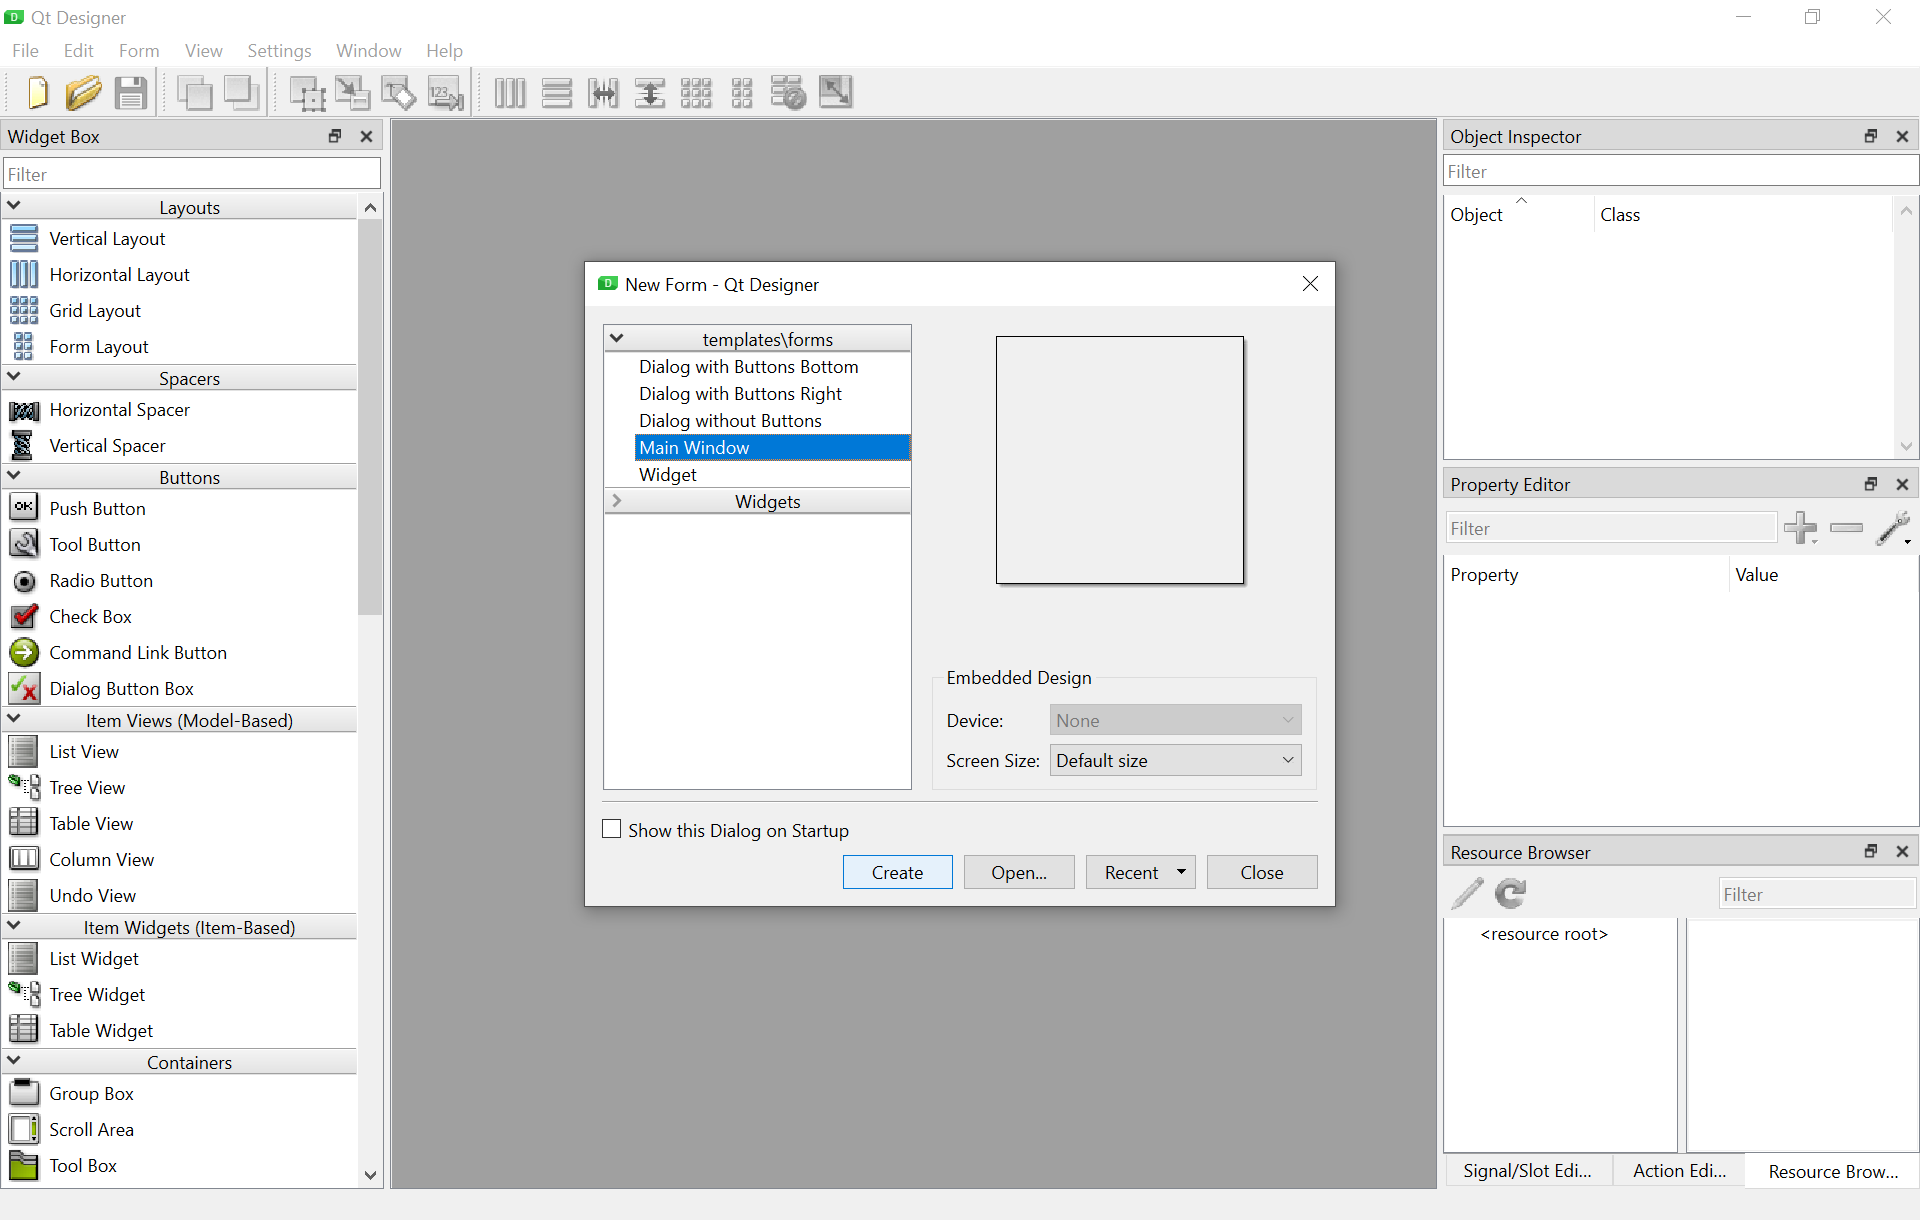
Because programming GUIs by hand would be time consuming, monotonous, and partially masochistic. The Qt toolkit comes with an extremely helpful tool called Qt Designer. Let’s switch over to it by running the following command pyside6-designer and giving it a moment to load up. Once the program is running click the New icon in the upper left hand corner of the tool bar, select Main Window from templates/forms, and press Create.
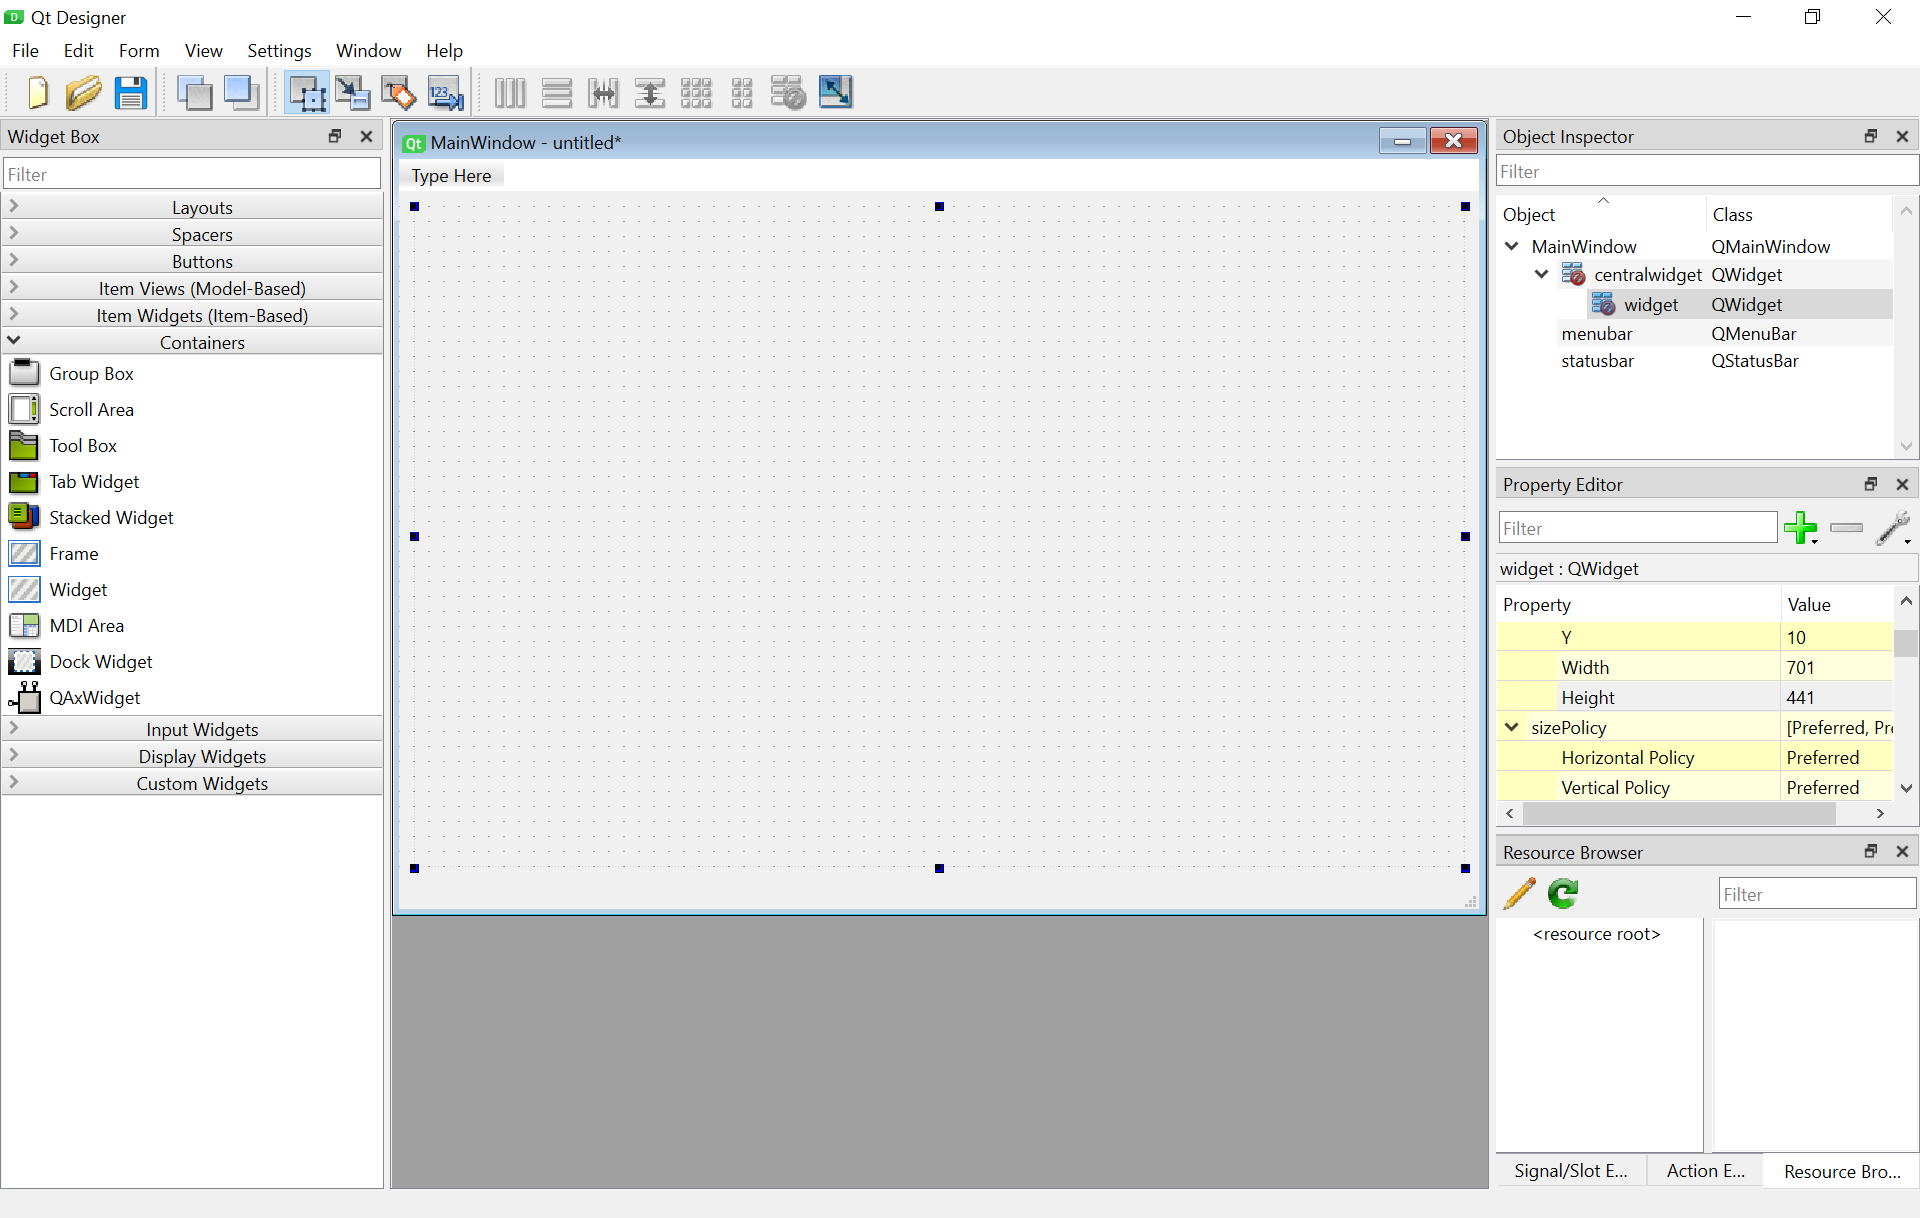
Once the main window has been created you can resize it if you want, I’ve resized mine to around 700x500. Now drag the Widget contain onto the main window and click the ‘Lay Out Vertically’ button so the Widget expands over the face of the main window. Rename the widget ‘graphWidget’.
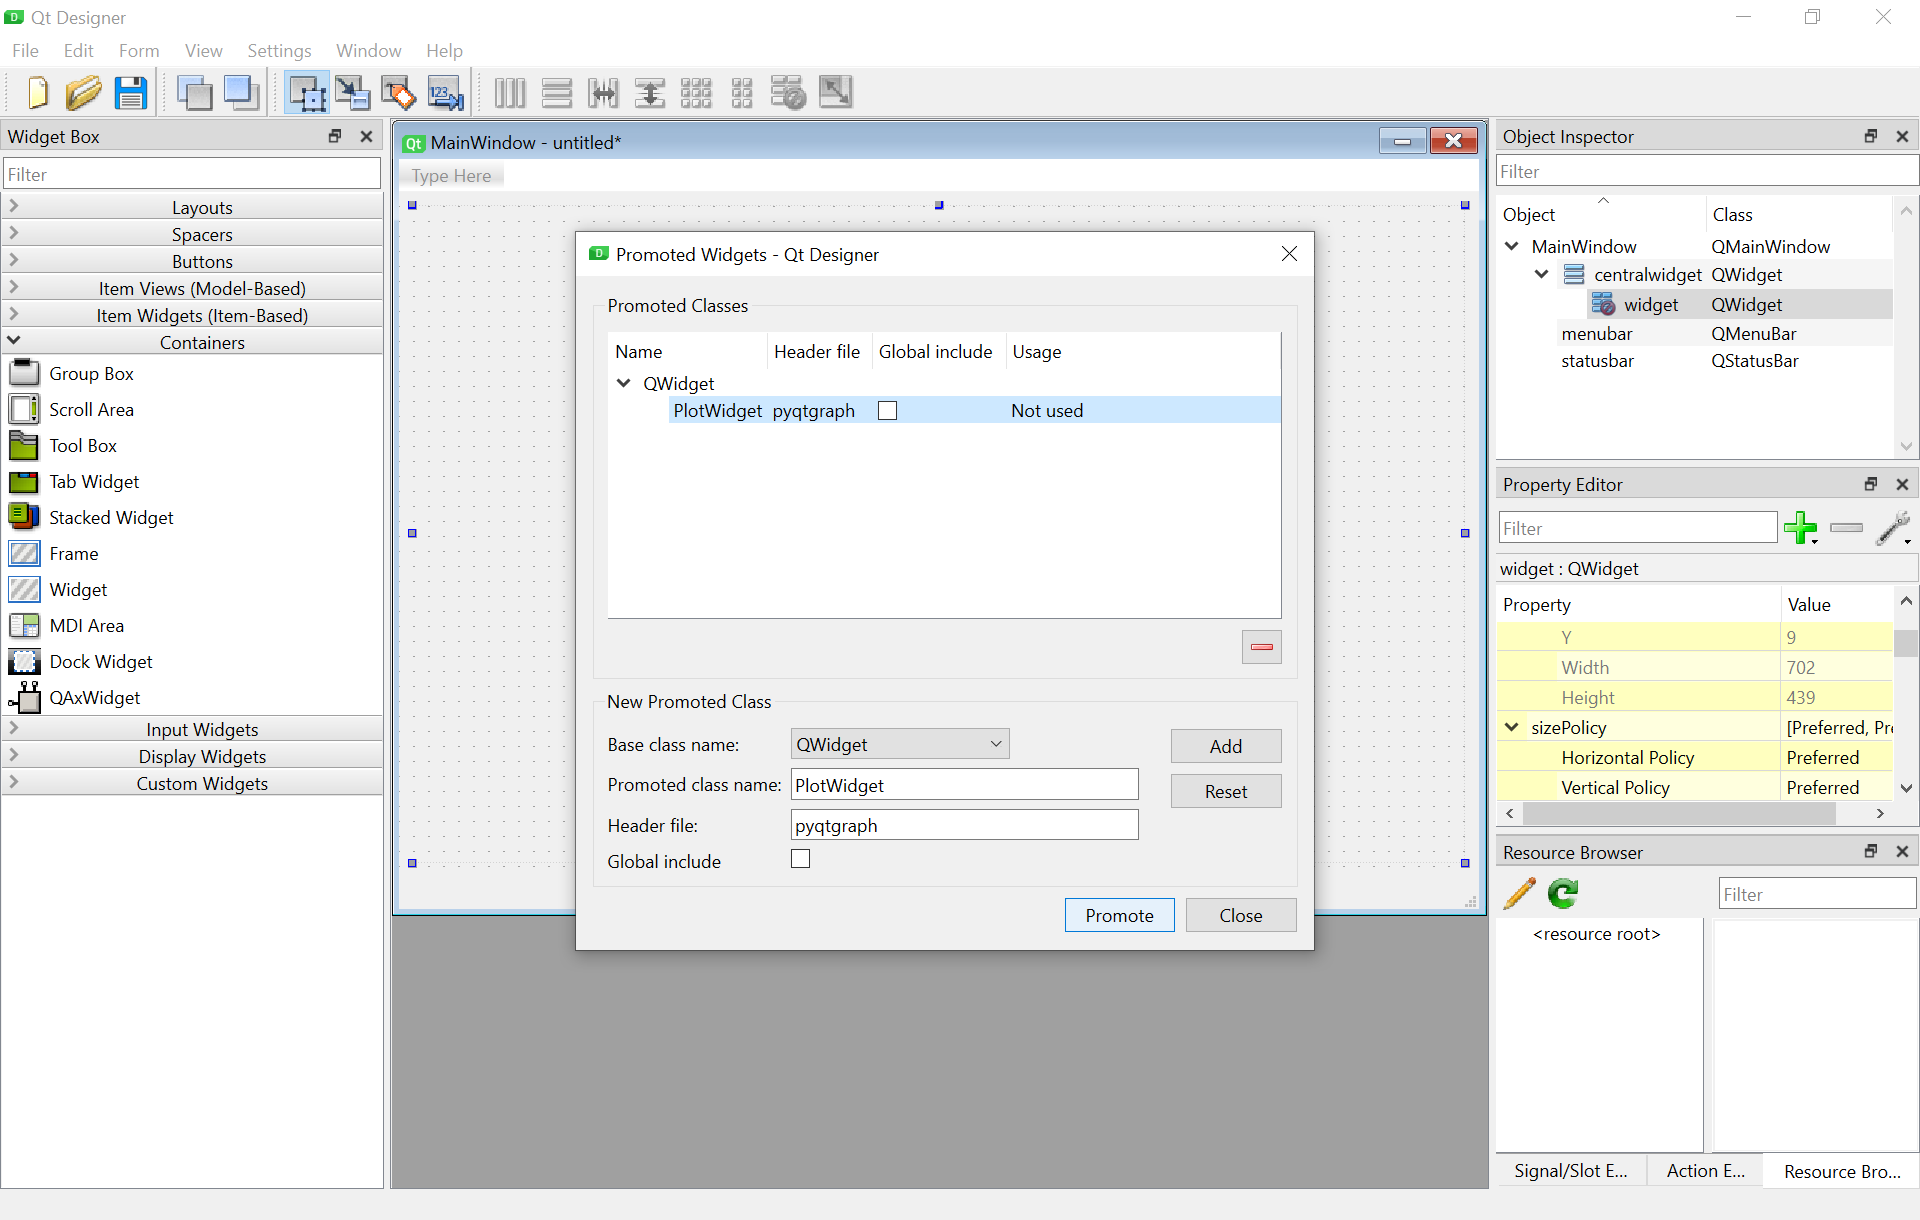
Right-click the Widget and select Promote to ... and fill in the promoted class name with ‘PlotWidget’ and header file with ‘pyqtgraph’, select the Promoted Class and click promote. Save the interface to \Desktop\virtual\Projects\crypto as crypto.ui by clicking on the save icon in the upper left hand side of the Qt designer. We can now generate python code with the command pyside6-uic crypto.ui -o ui_crypto.py and modify by inheritance and overriding.
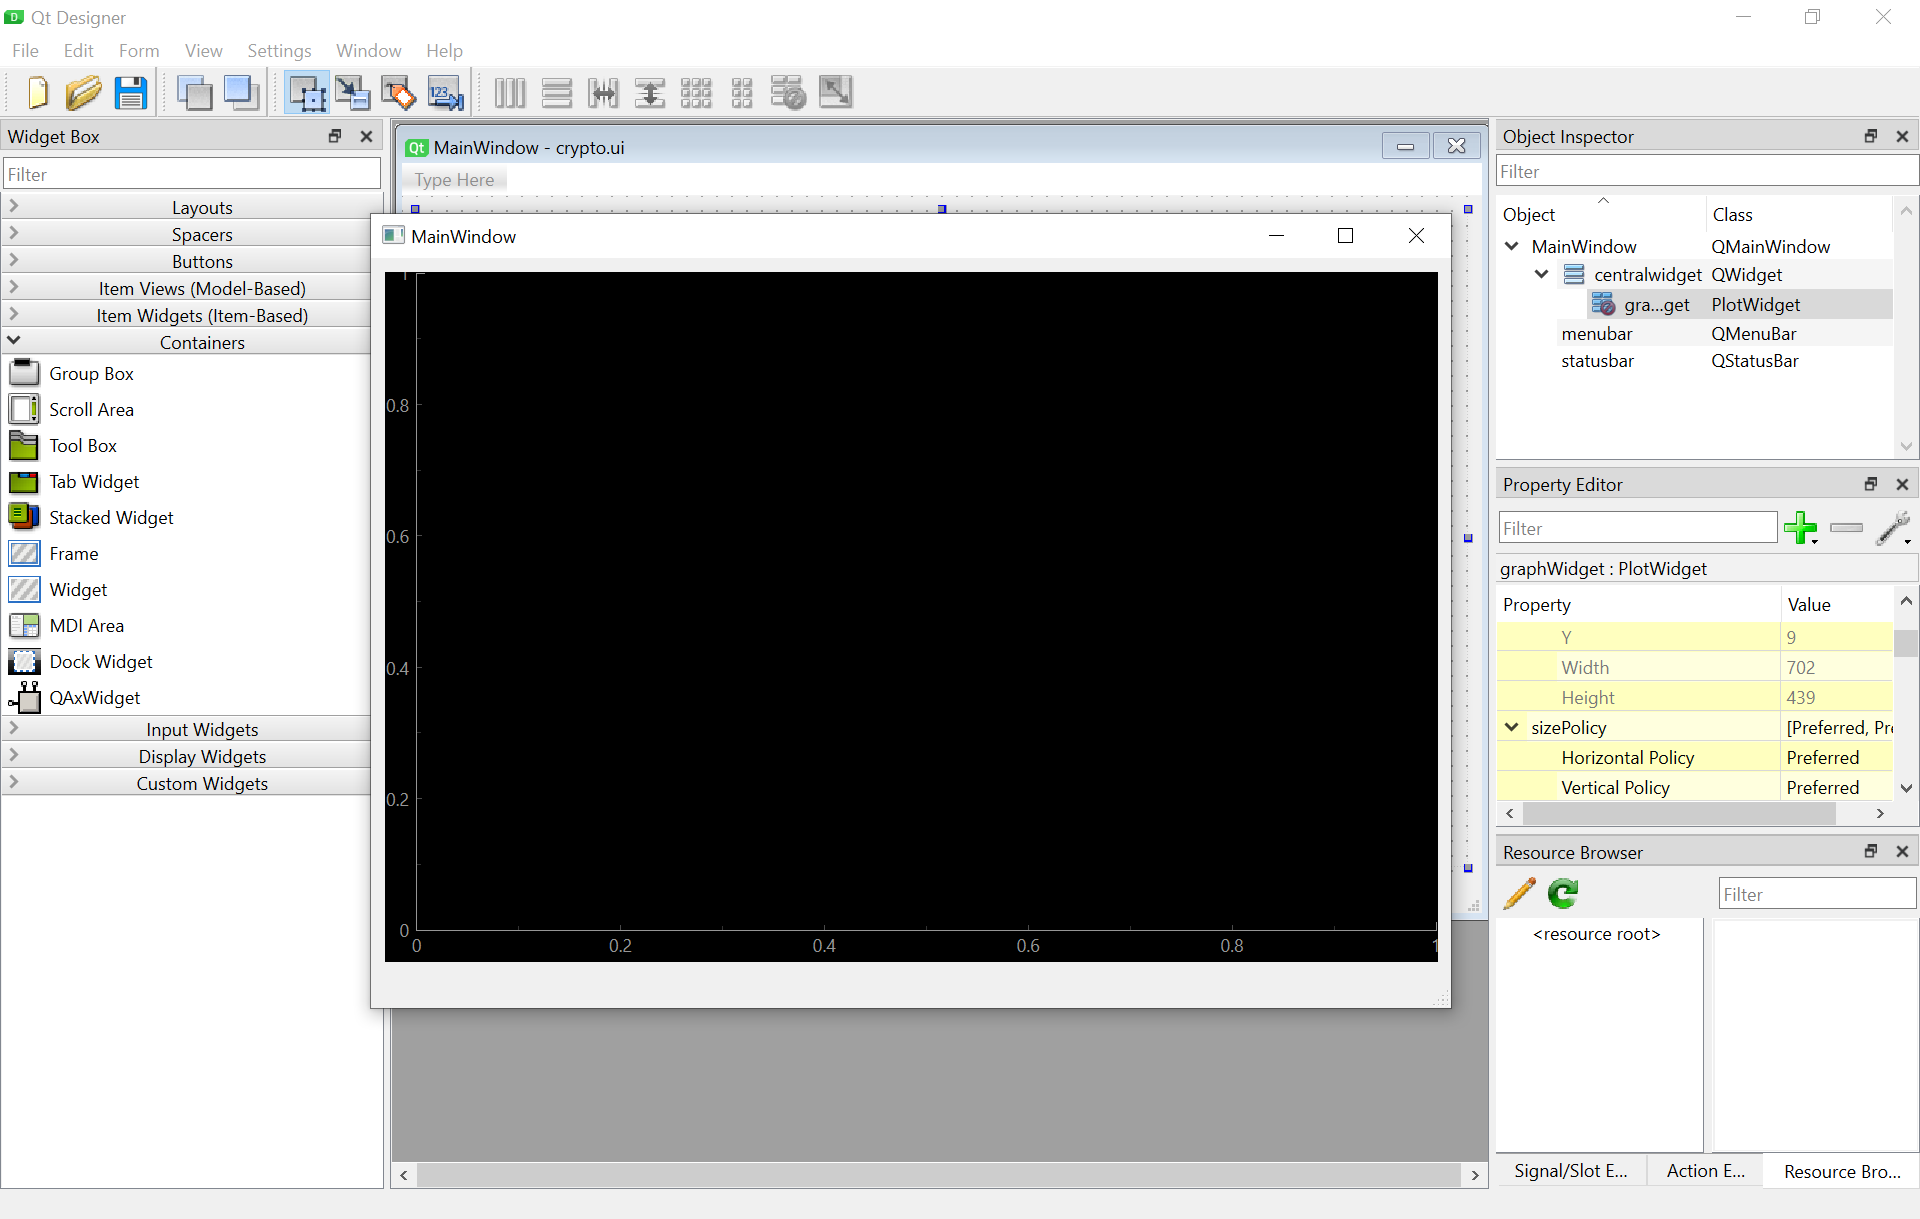
We want to import the Ui_MainWindow class from ui_crypto.py file into our new main.py program. So replace the previous code in main.py with the following. Running the main program with python main.py gives the main window in the above picture.
import sys

from PySide6.QtWidgets import QApplication, QMainWindow, QDialog
from ui_crypto         import Ui_MainWindow

def main():
    app = QApplication(sys.argv)
    app.setStyle('Fusion')
    window = MainWindow()
    window.show()
    app.exec()

class MainWindow(QMainWindow, Ui_MainWindow):
    def __init__(self, *args, **kwargs):
        super().__init__(*args, **kwargs)
        self.setupUi(self)

if __name__ == "__main__":
    main()
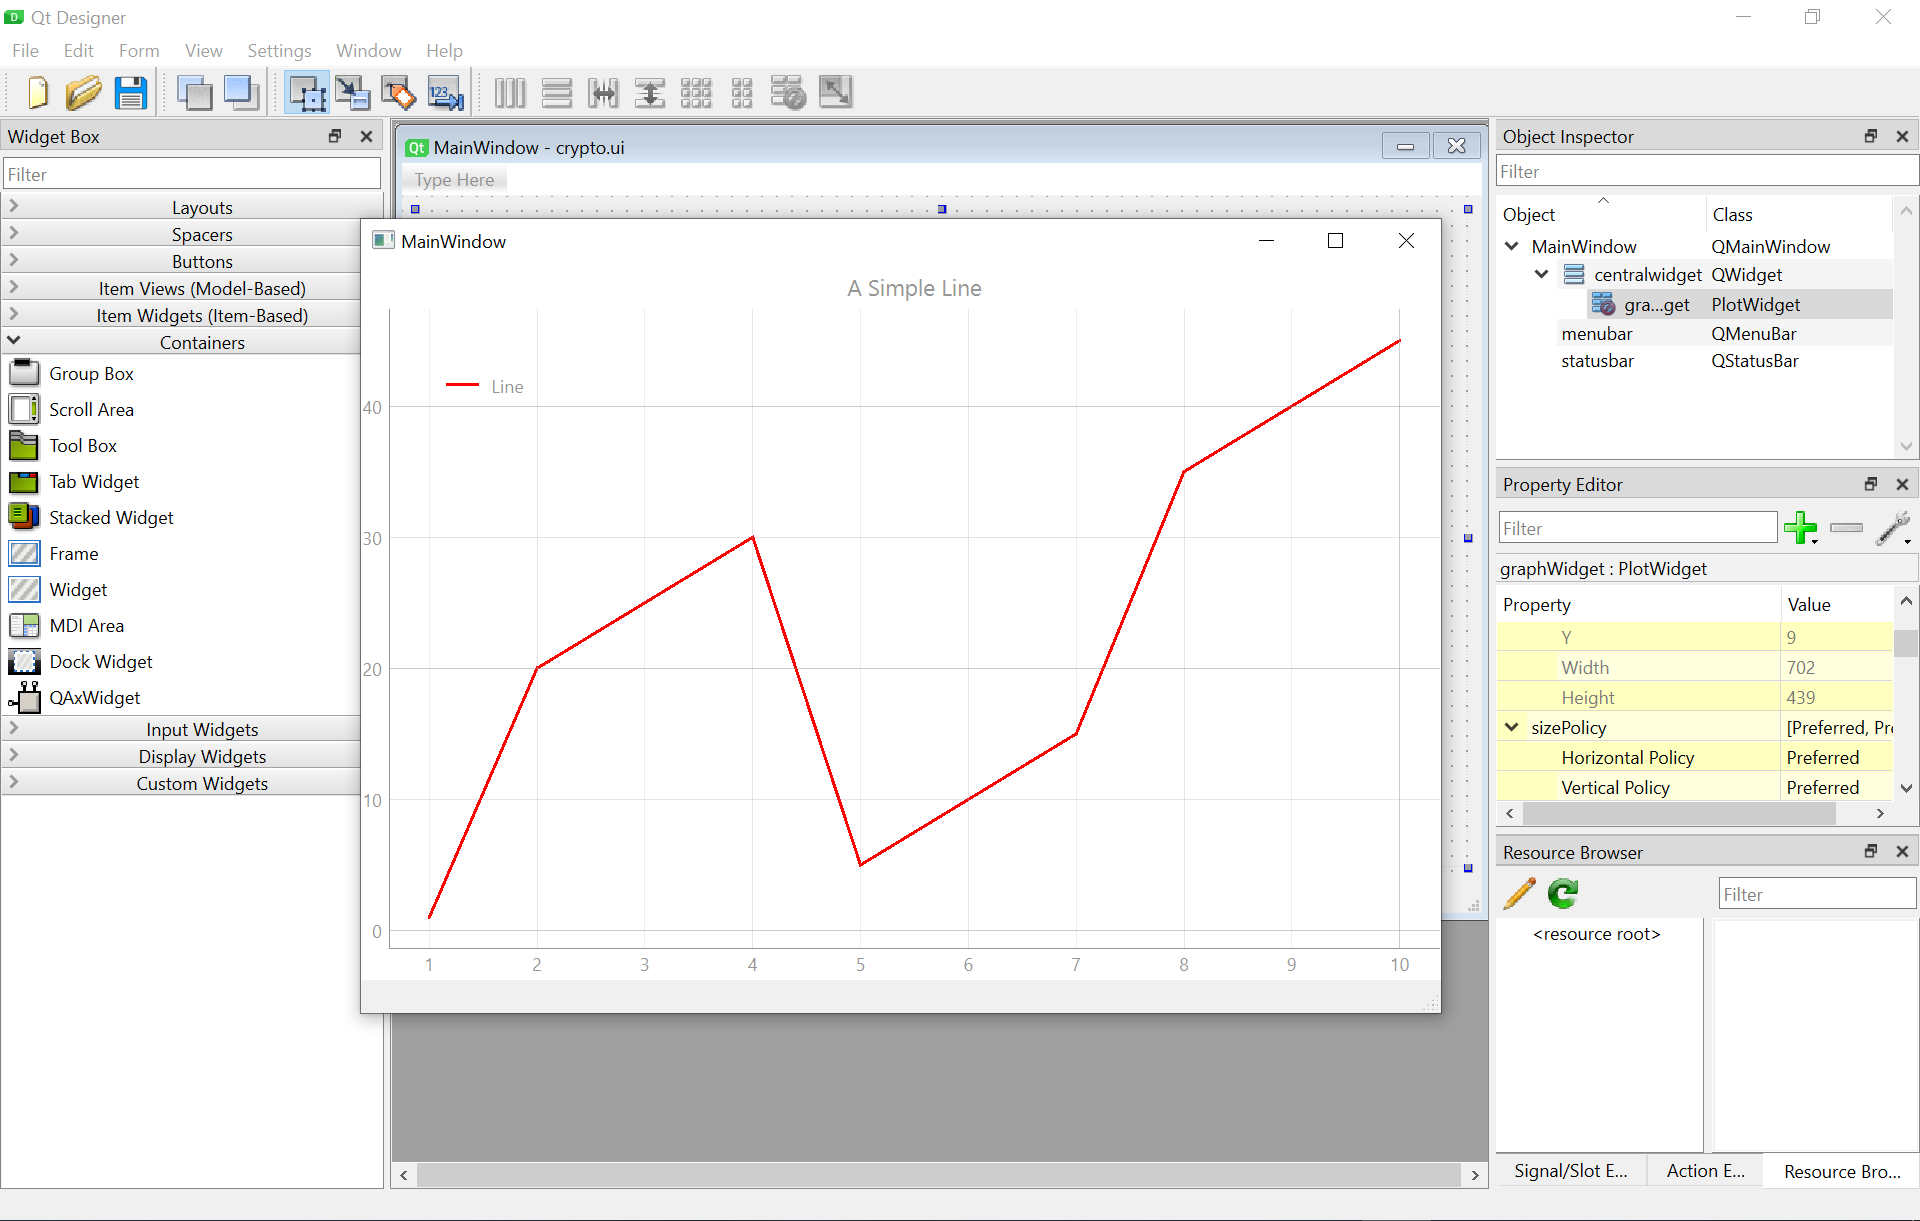
At this point we just have a black screen and thats not very useful, so we need to decide what we actually want to appear here. Lets test out a line or two before attempting Ichimoku cloud with Bill William’s fractals.
import sys

from PySide6.QtWidgets import QApplication, QMainWindow, QDialog
from ui_crypto         import Ui_MainWindow
from PySide6.QtCore    import Qt

import pyqtgraph as pg

def main():
    app = QApplication(sys.argv)
    app.setStyle('Fusion')
    window = MainWindow()
    window.show()
    app.exec()

class MainWindow(QMainWindow, Ui_MainWindow):
    def __init__(self, *args, **kwargs):
        super().__init__(*args, **kwargs)
        self.setupUi(self)

        # self.graphWidget = self.PlotWidget()
        self.setCentralWidget(self.graphWidget)

        # Style
        self.graphWidget.setBackground('w')

        # Title
        self.graphWidget.setTitle("A Simple Line")

        # Legend
        self.graphWidget.addLegend()

        # Grid
        self.graphWidget.showGrid(x=True, y=True)

        # Plot Line
        pen  = pg.mkPen(color="r", width=3, style=Qt.SolidLine)
        self.graphWidget.plot(x=range(1,10+1), y=[1,20,25,30,5,10,15,35,40,45], name="Line", pen=pen)

if __name__ == "__main__":
    main()
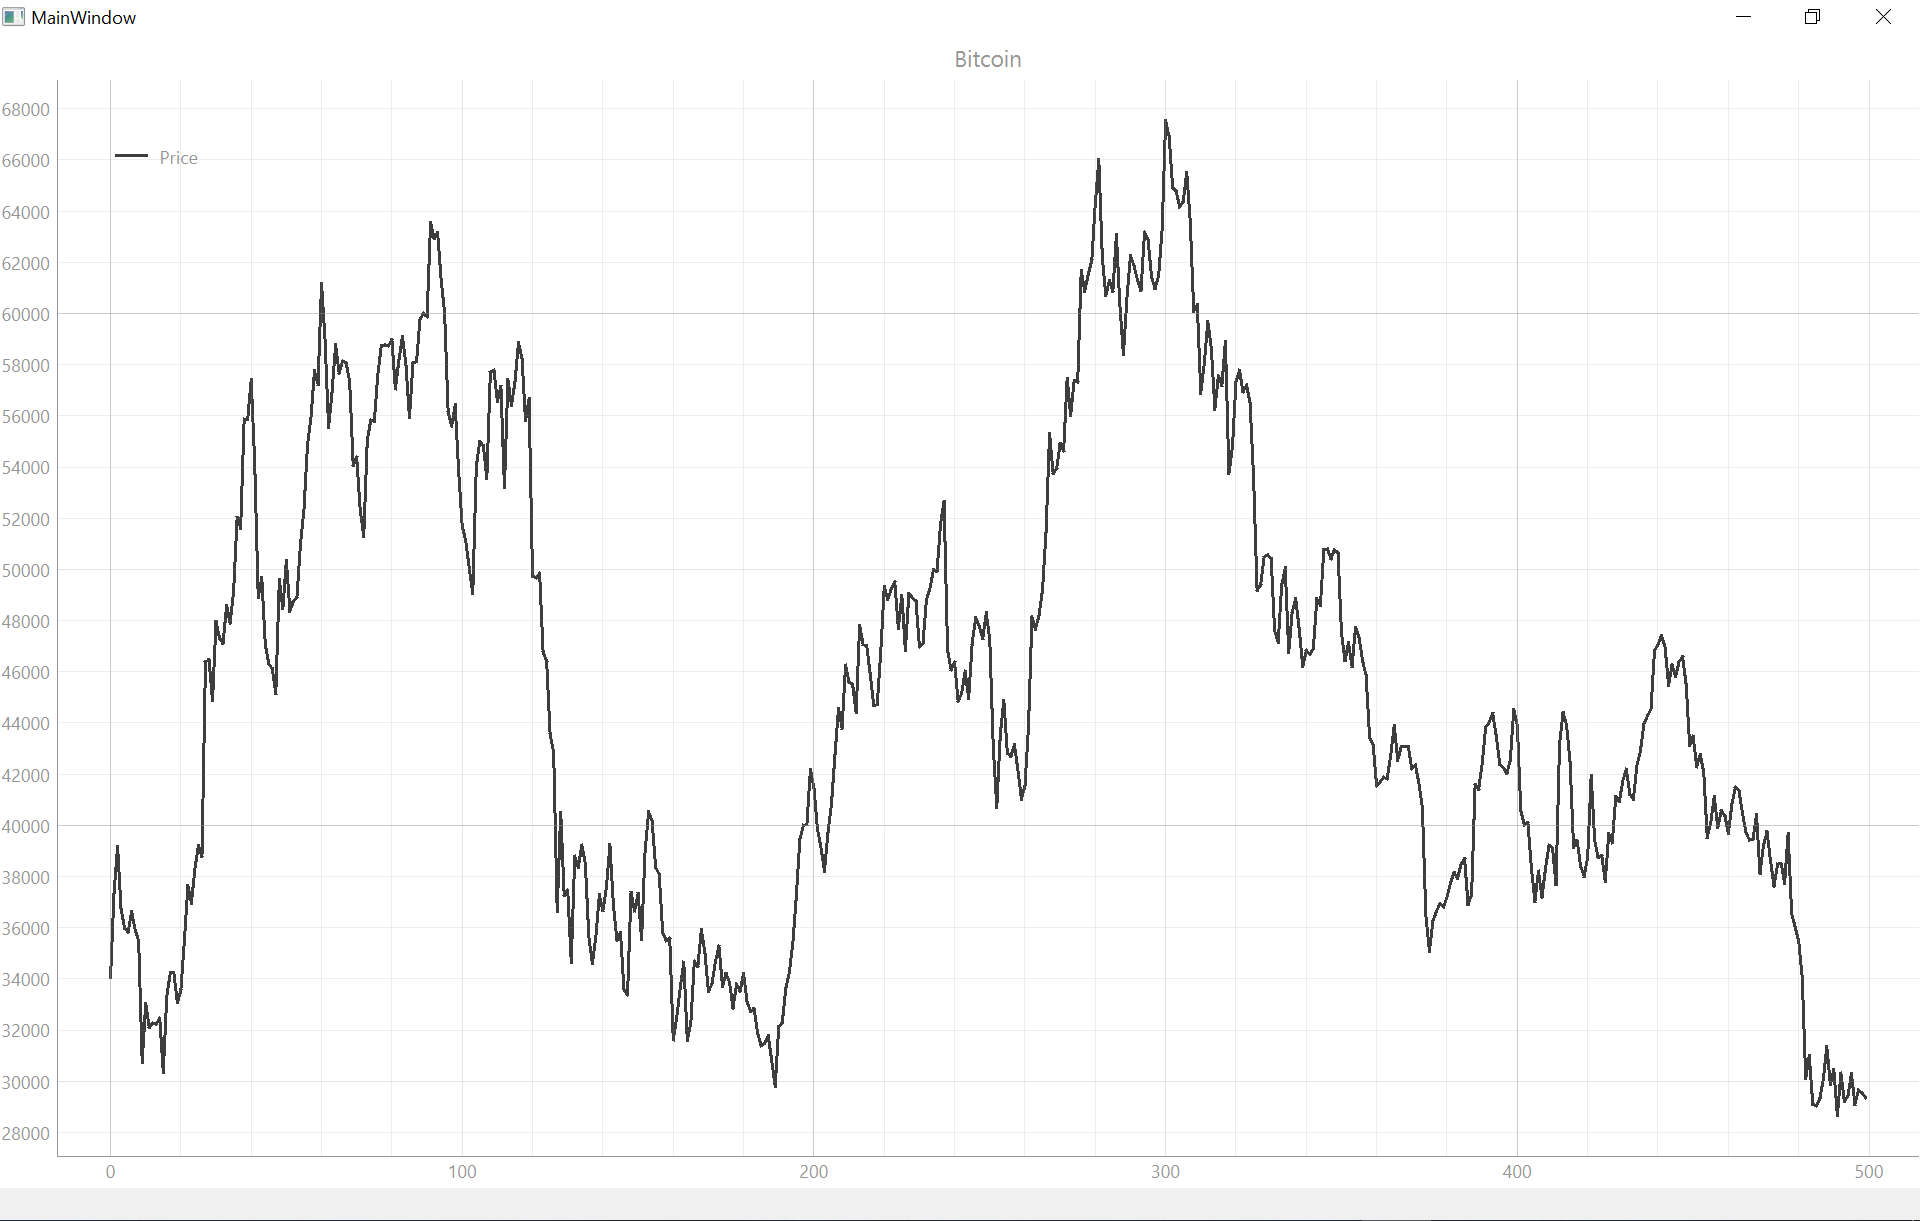 The picture above shows bitcoin’s close price plotted to the graph.
Lines are nice but not very useful unless they have some meaning that provides a reason as to why we are expending such great effort to plot them. We should go ahead and retrieve and plot the price action from Binance.us. Create the following directory structure.
Projects/crypto/
├─ binance/
│  ├─ __init__.py
│  ├─ api.py
│  ├─ binance.py
│  └─ market.py
├─ crypto.ui
├─ main.py
└─ ui_crypto.py
Change main to the following code.
import sys

from PySide6.QtWidgets import QApplication, QMainWindow, QDialog
from ui_crypto         import Ui_MainWindow
from PySide6.QtCore    import Qt

from binance.binance   import Binance

import pyqtgraph as pg

def main():
    app = QApplication(sys.argv)
    app.setStyle('Fusion')
    window = MainWindow()
    window.show()
    app.exec()

class MainWindow(QMainWindow, Ui_MainWindow):
    def __init__(self, *args, **kwargs):
        super().__init__(*args, **kwargs)
        self.setupUi(self)

        # self.graphWidget = self.PlotWidget()
        self.setCentralWidget(self.graphWidget)

        # Style
        self.graphWidget.setBackground('w')

        # Title
        self.graphWidget.setTitle("Bitcoin")

        # Legend
        self.graphWidget.addLegend()

        # Grid
        self.graphWidget.showGrid(x=True, y=True)

        # Plot Bitcoin
        bi = Binance()
        df = bi.candles(
            symbol   = "BTCUSDT",
            interval = "1d"
        )

        price = pg.mkPen(color="#3d3d3d", width=3, style=Qt.SolidLine)
        self.graphWidget.plot(df["close"], name="Price", pen=price)

if __name__ == "__main__":
    main()
Copy the following code into api.py and save the file.
from requests.exceptions import HTTPError
from functools           import wraps

class BinanceAPI:

    API_KEY    = "YOUR API KEY HERE"
    API_SECRET = "YOUR API SECRET HERE"
    HEADER     = {
        'get' : {"X-MBX-APIKEY": API_KEY},
    }

    # Base + Version
    __baseEndpoint = 'https://api.binance.us'
    ENDPOINT       = __baseEndpoint + '/api/v3/'

    @staticmethod
    def error_handler(func):
        @wraps(func)
        def logic(*args, **kwargs):
            resp = func(*args, **kwargs)

            if not resp.ok:
                raise HTTPError(f"[!] Error: {resp.status_code} {resp.reason} {resp.json()}")

            if resp.status_code != 200:
                print(f"[!] Warning: {resp.status_code} {resp.reason}")

            return resp
        return logic

    @staticmethod
    def deserialize(func):
        @wraps(func)
        def transform(*args, **kwargs):
            try:
                resp = func(*args, **kwargs)
            except HTTPError as error:
                print(error)
                return False

            return resp.json()
        return transform
Copy the following code into binance.py and save the file.
from binance.market import MarketData
from datetime       import datetime

import numpy  as np
import pandas as pd

import time

class Binance(MarketData):
    """
    The purpose of this class is to make sense of the data provided by its inherited methods.
    """

    def test_connection(self):
        return self.ping()

    def candles(self, symbol="BTCUSDT", interval="1d", startTime=None, endTime=None, limit=500):
        """
        Returns kline data in a pandas DataFrame.

                                    open      high       low     close      volume
        date
        2022-01-07 23:59:59.999  41813.06  42003.24  41763.62  41877.37    3.722429
        2022-01-08 03:59:59.999  41953.26  42199.05  41775.61  41936.91   16.839122
        2022-01-08 07:59:59.999  41932.70  42044.44  41395.90  41610.62   34.417348
        2022-01-08 11:59:59.999  41616.50  41724.13  40502.75  40802.00   74.394267
        2022-01-08 15:59:59.999  40871.32  42318.07  40726.98  41691.66   37.362512
        ...                           ...       ...       ...       ...         ...
        2022-01-21 03:59:59.999  39120.92  39279.94  38682.95  38880.04   25.458106
        2022-01-21 07:59:59.999  38903.98  39030.43  37706.69  38849.32  121.282145
        2022-01-21 11:59:59.999  38866.64  39057.23  37857.95  37954.55  115.010300
        2022-01-21 15:59:59.999  37967.73  38508.49  35450.11  36474.82  350.844053
        2022-01-21 19:59:59.999  36445.31  36832.05  36157.48  36368.72   52.074380

        [84 rows x 5 columns]
        """

        # Open Time / Open / High / Low / Close / Volume / Close Time /
        # Quote Volume / Trades / Taker Buy Base / Taker Buy Quote / Ignore /
        data    = self.klines( symbol, interval, startTime, endTime, limit )

        # Close Time / Open / High / Low / Close / Volume /
        dateObj = lambda x: datetime.fromtimestamp(x/1000)

        df = pd.DataFrame(
            # Open / High / Low / Close / Volume / Datetime Object
            data    = [[dateObj(i[6])] + [np.double(j) for j in i[1:6]] for i in data],
            columns = ['date', 'open', 'high', 'low', 'close', 'volume'],
            # dtype   = np.double
        )
        df.set_index('date', inplace=True)

        return df

def say(string):
    t = time.strftime("%Y%m%d %I:%M:%S", time.localtime())
    print(f"[{t}] {string.title()} ...")
    # time.sleep(1)
Copy the following code into market.py and save the file.
from binance.api import BinanceAPI

import requests

class MarketData(BinanceAPI):

    @BinanceAPI.deserialize
    @BinanceAPI.error_handler
    def ping(self):
        """
        GET /api/v3/ping

        Test connectivity to the Rest API.

        Weight: 1

        Parameters: NONE

        Response: {}
        """
        return requests.get(url = BinanceAPI.ENDPOINT + 'ping')

    @BinanceAPI.deserialize
    @BinanceAPI.error_handler
    def klines(self, symbol="BTCUSDT", interval="1d", startTime=None, endTime=None, limit=500):
        """
        GET /api/v3/klines

        Kline/candlestick bars for a symbol.
        Klines are uniquely identified by their open time.

        Weight: 1

        | Name      | Type   | Mandatory | Description             |
        |-----------|--------|-----------|-------------------------|
        | symbol    | STRING | YES       |                         |
        | interval  | ENUM   | YES       |                         |
        | startTime | LONG   | NO        |                         |
        | endTime   | LONG   | NO        |                         |
        | limit     | INT    | NO        | Default: 500; max 1000. |

        If startTime and endTime are not sent, the most recent klines are returned.

        Response:

        [
            [
                1499040000000, // Open time
                "0.00386200",  // Open
                "0.00386200",  // High
                "0.00386200",  // Low
                "0.00386200",  // Close
                "0.47000000",  // Volume
                1499644799999, // Close time
                "0.00181514",  // Quote asset volume
                1,             // Number of trades
                "0.47000000",  // Taker buy base asset volume
                "0.00181514",  // Taker buy quote asset volume
                "0" // Ignore.
            ]
        ]

        m -> minutes; h -> hours; d -> days; w -> weeks; M -> months
        """
        return requests.get(
            url     = BinanceAPI.ENDPOINT + 'klines',
            params  = {
                'symbol'    : symbol,
                'interval'  : interval,
                'startTime' : startTime,
                'endTime'   : endTime,
                'limit'     : limit
            }
        )
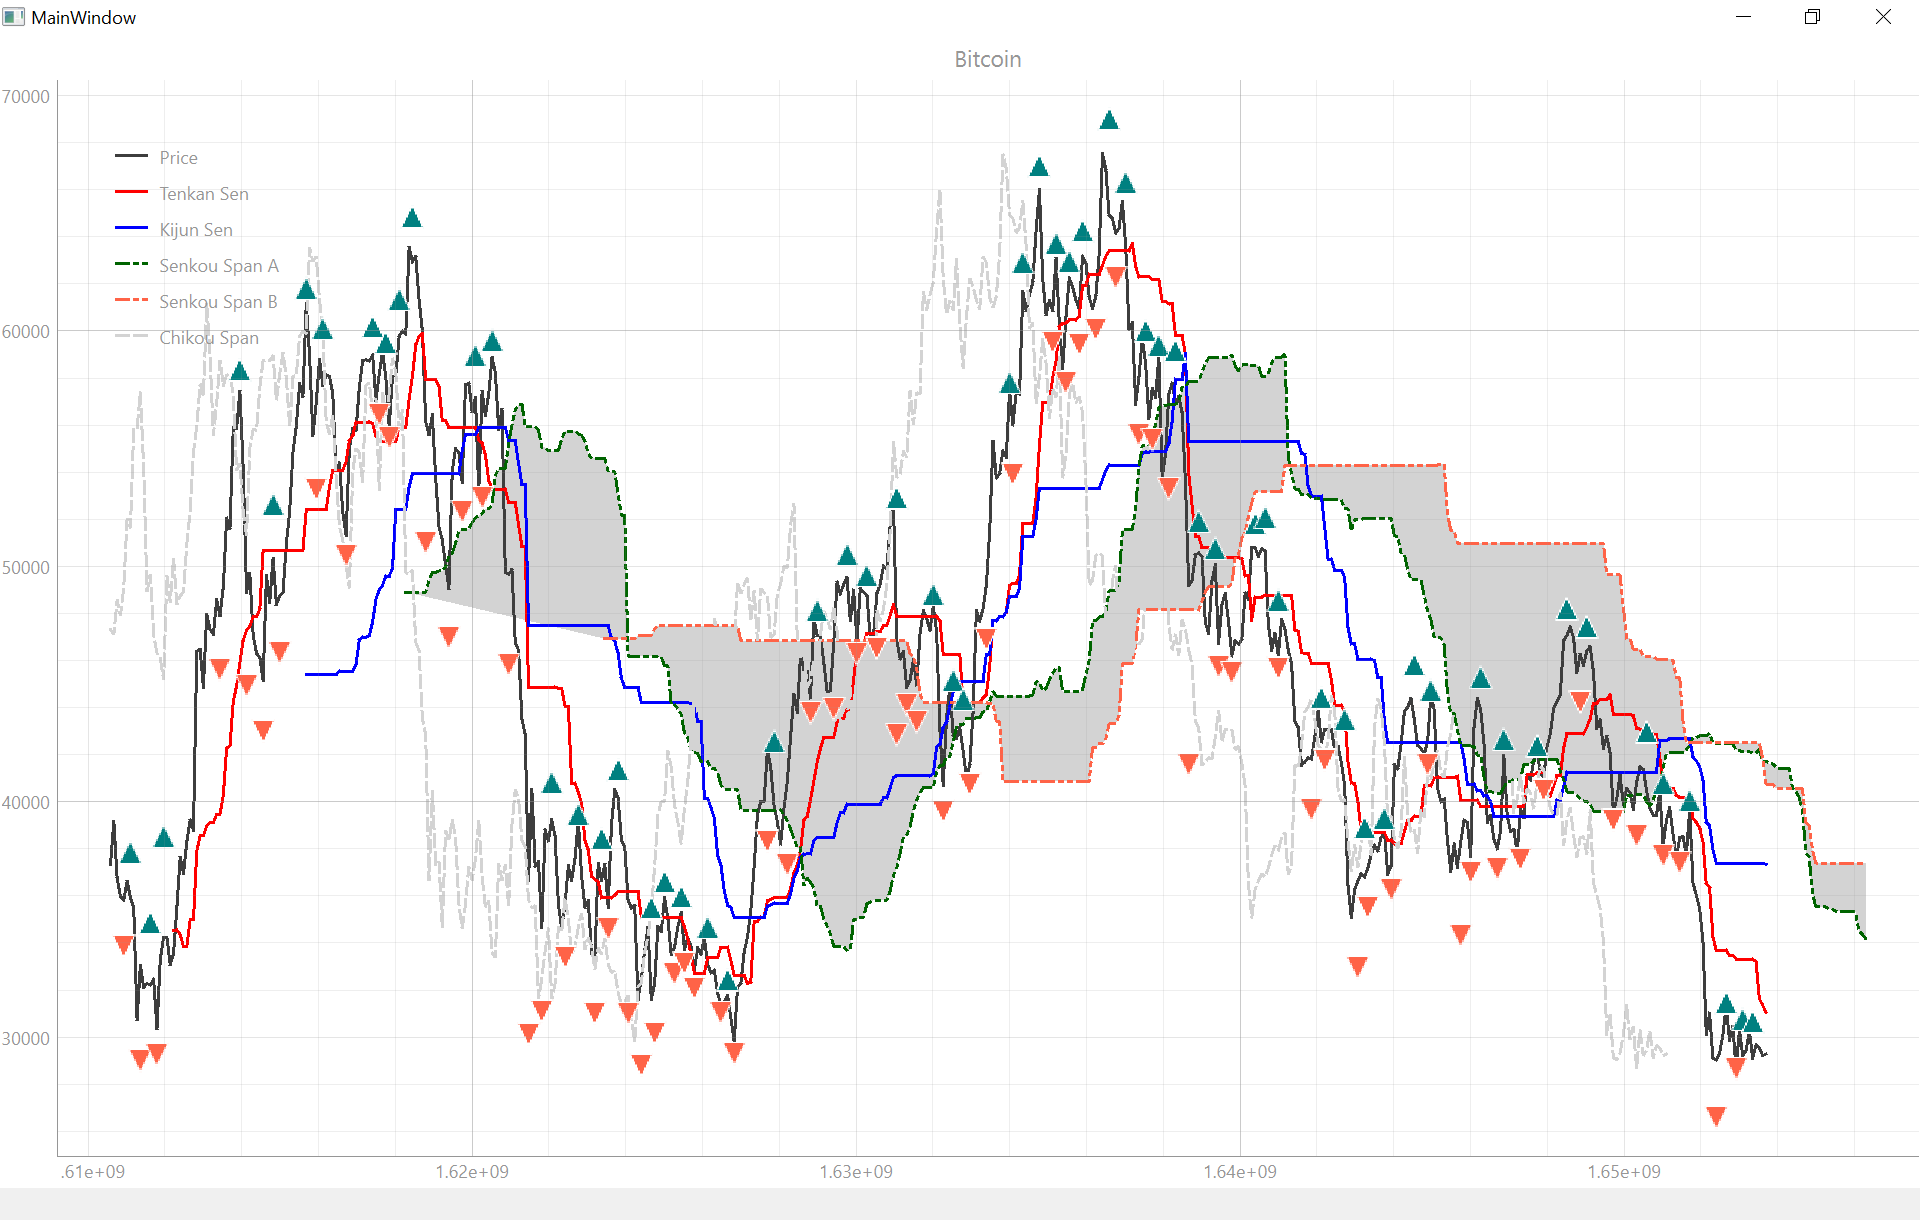 The picture above shows bitcoin’s close price plotted with Ichimoku Cloud & William’s Fractals. 20 / 60 / 120 / 30 / 30 are the recommended settings for Ichimoku cloud when applied to Bitcoin.
We would like to be able to apply technical analysis to the bitcoin price, and in order to do that we need to program the routines that would supply us with the information to plot. Luckily, in previous articles, namely Ichimoku Kinko Hyo (Ichimoku Cloud) and Bill William’s Alligator & Fractals I already did the work, so we can reuse some of the code. Create the additional analysis directory & file structure.
Projects/crypto/
├─ analysis/
│  ├─ __init__.py
│  ├─ ichimoku.py
│  └─ williams.py
├─ binance/
│  ├─ __init__.py
│  ├─ api.py
│  ├─ binance.py
│  └─ market.py
├─ crypto.ui
├─ main.py
└─ ui_crypto.py
Change main to the following code.
import sys

from PySide6.QtWidgets import QApplication, QMainWindow, QDialog
from ui_crypto         import Ui_MainWindow
from PySide6.QtCore    import Qt

from binance.binance   import Binance
from analysis.williams import Fractals
from analysis.ichimoku import IchimokuKinkoHyo

import pyqtgraph as pg

def main():
    app = QApplication(sys.argv)
    app.setStyle('Fusion')
    window = MainWindow()
    window.show()
    app.exec()

class MainWindow(QMainWindow, Ui_MainWindow):
    def __init__(self, *args, **kwargs):
        super().__init__(*args, **kwargs)
        self.setupUi(self)

        # self.graphWidget = self.PlotWidget()
        self.setCentralWidget(self.graphWidget)

        # Style
        self.graphWidget.setBackground('w')

        # Title
        self.graphWidget.setTitle("Bitcoin")

        # Legend
        self.graphWidget.addLegend()

        # Grid
        self.graphWidget.showGrid(x=True, y=True)

        # Plot Bitcoin
        bi = Binance()
        df = bi.candles(
            symbol   = "BTCUSDT",
            interval = "1d"
        )

        dates = df.index.to_pydatetime()
        dates = [i.timestamp() for i in dates]

        price = pg.mkPen(color="#3d3d3d", width=3, style=Qt.SolidLine)
        self.graphWidget.plot(dates, df["close"], name="Price", pen=price)

        # Plot Technicals
        IchimokuKinkoHyo().plot_qt(df, self.graphWidget, pg, Qt)
        Fractals().plot_qt_f(df, self.graphWidget, pg, Qt)

if __name__ == "__main__":
    main()
Copy the following code into ichimoku.py and save the file.
from datetime import timedelta
from numpy    import nan

class IchimokuKinkoHyo:

    def __tenkan_sen(self, df, period=20):
        """
        Tenkan-sen (Conversion Line): (20-period high + 20-period low)/2))
            The default setting is 9 periods and can be adjusted. On a daily chart,
            this line is the midpoint of the 9-day high-low range, which is almost two weeks.
        """
        high = df['high'].rolling(period).max()
        low  = df['low'].rolling(period).min()
        return (high + low)/2

    def __kijun_sen(self, df, period=60):
        """
        Kijun-sen (Base Line): (60-period high + 60-period low)/2))
            The default setting is 26 periods and can be adjusted. On a daily chart,
            this line is the midpoint of the 26-day high-low range, which is almost one month).
        """
        high = df['high'].rolling(period).max()
        low  = df['low'].rolling(period).min()
        return (high + low)/2

    def __senkou_span_a(self, df, future=30):
        """
        Senkou Span A (Leading Span A): (Conversion Line + Base Line)/2))
            This is the midpoint between the Conversion Line and the Base Line. The Leading Span A forms one of the two cloud boundaries.
            It is referred to as "Leading" because it is plotted 26 periods in the future and forms the faster cloud boundary.
        """
        return ((self.__tenkan_sen(df) + self.__kijun_sen(df))/2).shift(future)

    def __senkou_span_b(self, df, period=120, future=30):
        """
        Senkou Span B (Leading Span B): (120-period high + 120-period low)/2))
            On the daily chart, this line is the midpoint of the 52-day high-low range, which is a little less than 3 months.
            The default calculation setting is 52 periods, but can be adjusted. This value is plotted 26 periods in the future
            and forms the slower cloud boundary.
        """
        high = df['high'].rolling(period).max()
        low  = df['low'].rolling(period).min()
        # return high.add(low).divide(2).shift(future)
        return ((high + low)/2).shift(future)

    def __kumo(self, df):
        """
        Senkou Span A & Senkou Span B
        """
        return self.__senkou_span_a(df), self.__senkou_span_b(df)

    def __chikou_span(self, df, offset=30):
        """
        Chikou Span (Lagging Span): Close plotted 30 days in the past
            The default setting is 26 periods, but can be adjusted.
        """
        return df['close'].shift(-30)

    def _ichimoku_cloud(self, df, t=20, k=60, b=120, c=30, future=30):
        """
        Settings: 20/60/120/30
        """
        # lastDate = datetime.strptime(lastDate, "%Y-%m-%d %H:%M:%S.%f")
        lastDate = df.index[-1].to_pydatetime()

        for i in range(1, future+1):
            df.loc[lastDate+timedelta(days=i)] = [nan]*5

        return self.__tenkan_sen(df, t),            \
               self.__kijun_sen(df, k),             \
               self.__senkou_span_a(df, future),    \
               self.__senkou_span_b(df, b, future), \
               self.__chikou_span(df, c)

    def plot_qt(self, df, graphWidget, pg, Qt):
        tenkan,kijun,senkouA,senkouB,chikou = self._ichimoku_cloud(df)

        dates = df.index.to_pydatetime()
        dates = [i.timestamp() for i in dates]

        penTenkan  = pg.mkPen(color="r",          width=3, style=Qt.SolidLine)
        penKijun   = pg.mkPen(color="b",          width=3, style=Qt.SolidLine)
        penSenkouA = pg.mkPen(color="dark green", width=3, style=Qt.DashDotDotLine)
        penSenkouB = pg.mkPen(color="tomato",     width=3, style=Qt.DashDotDotLine)
        penChikou  = pg.mkPen(color="light grey", width=3, style=Qt.DashLine)

        # plotTenkan = self.graphWidget.plot(x, y, name="Tenkan Sen", pen=penTenkan, symbol='+', symbolSize=15, symbolBrush=('b'))
        plotTenkan  = graphWidget.plot(dates, tenkan,  name="Tenkan Sen",    pen=penTenkan)
        plotKijun   = graphWidget.plot(dates, kijun,   name="Kijun Sen",     pen=penKijun)
        plotSenkouA = graphWidget.plot(dates, senkouA, name="Senkou Span A", pen=penSenkouA)
        plotSenkouB = graphWidget.plot(dates, senkouB, name="Senkou Span B", pen=penSenkouB)
        plotChikou  = graphWidget.plot(dates, chikou,  name="Chikou Span",   pen=penChikou)

        fillAB      = pg.FillBetweenItem(plotSenkouA, plotSenkouB, 'light grey')
        graphWidget.addItem(fillAB)
Copy the following code into williams.py and save the file.
from pandas   import concat
from datetime import timedelta
from numpy    import nan

class Fractals:

    def __williams_bearish_fractal(self, df):
        """
        GREEN or UP = BEARISH

        The Formulas for Fractals Are:

        Bearish Fractal = High(N) > High(N−2) and
                          High(N) > High(N−1) and
                          High(N) > High(N+1) and
                          High(N) > High(N+2)

        where:
            N   = High of the current price bar
            N−2 = High of price bar two periods to the left of N
            N−1 = High of price bar one period to the left of N
            N+1 = High of price bar one period to the right of N
            N+2 = High of price bar two periods to the right of N
        """

        def bear_fractals(iterable):
            for segment in ( iterable[i:i+5] for i in range(len(iterable)-(5-1)) ):
                if all([ segment[2] > segment[i] for i in [0, 1, 3, 4] ]):
                    yield segment[2:3]

        series = concat(bear_fractals(df['high']), axis=0)
        series.name = 'up'
        return series

    def __williams_bullish_fractal(self, df):
        """
        RED or DOWN = BULLISH

        Bullish Fractal = Low(N) < Low(N−2) and
                          Low(N) < Low(N−1) and
                          Low(N) < Low(N+1) and
                          Low(N) < Low(N+2)

        where:
            N   = Low of the current price bar
            N−2 = Low of price bar two periods to the left of N
            N−1 = Low of price bar one period to the left of N
            N+1 = Low of price bar one period to the right of N
            N+2 = Low of price bar two periods to the right of N
        """
        def bull_fractals(iterable):
            for segment in ( iterable[i:i+5] for i in range(len(iterable)-(5-1)) ):
                if all([ segment[2] < segment[i] for i in [0, 1, 3, 4] ]):
                    yield segment[2:3]

        series = concat(bull_fractals(df['low']), axis=0)
        series.name = 'down'
        return series

    def _williams_fractal(self, df):
        """
        1. Isolate a high/low (N) point on the chart.
        2. If there are two lower highs to the left of the high or
           two higher lows to the left of the low (N-2 and N-1),
           there is a possible pattern. The pattern still needs
           two more bars on the right to confirm.
        3. If two lower highs occur after the high then a bearish
           fractal is complete (N+1 and N+2). If two higher lows
           occur after the low a bullish fractal is complete.

        https://www.investopedia.com/terms/f/fractal.asp
        """

        s1 = self.__williams_bearish_fractal(df)
        s2 = self.__williams_bullish_fractal(df)

        df = df.merge(s1, how='outer', on='date')
        df = df.merge(s2, how='outer', on='date')

        return df

    def plot_qt_f(self, df, graphWidget, pg, Qt):
        df = self._williams_fractal(df)

        dates = df.index.to_pydatetime()
        dates = [i.timestamp() for i in dates]

        graphWidget.plot(dates, df["up"],   symbolPen='w', symbol='t1', symbolSize=15, symbolBrush=("teal"))
        graphWidget.plot(dates, df["down"], symbolPen='w', symbol='t',  symbolSize=15, symbolBrush=("tomato"))
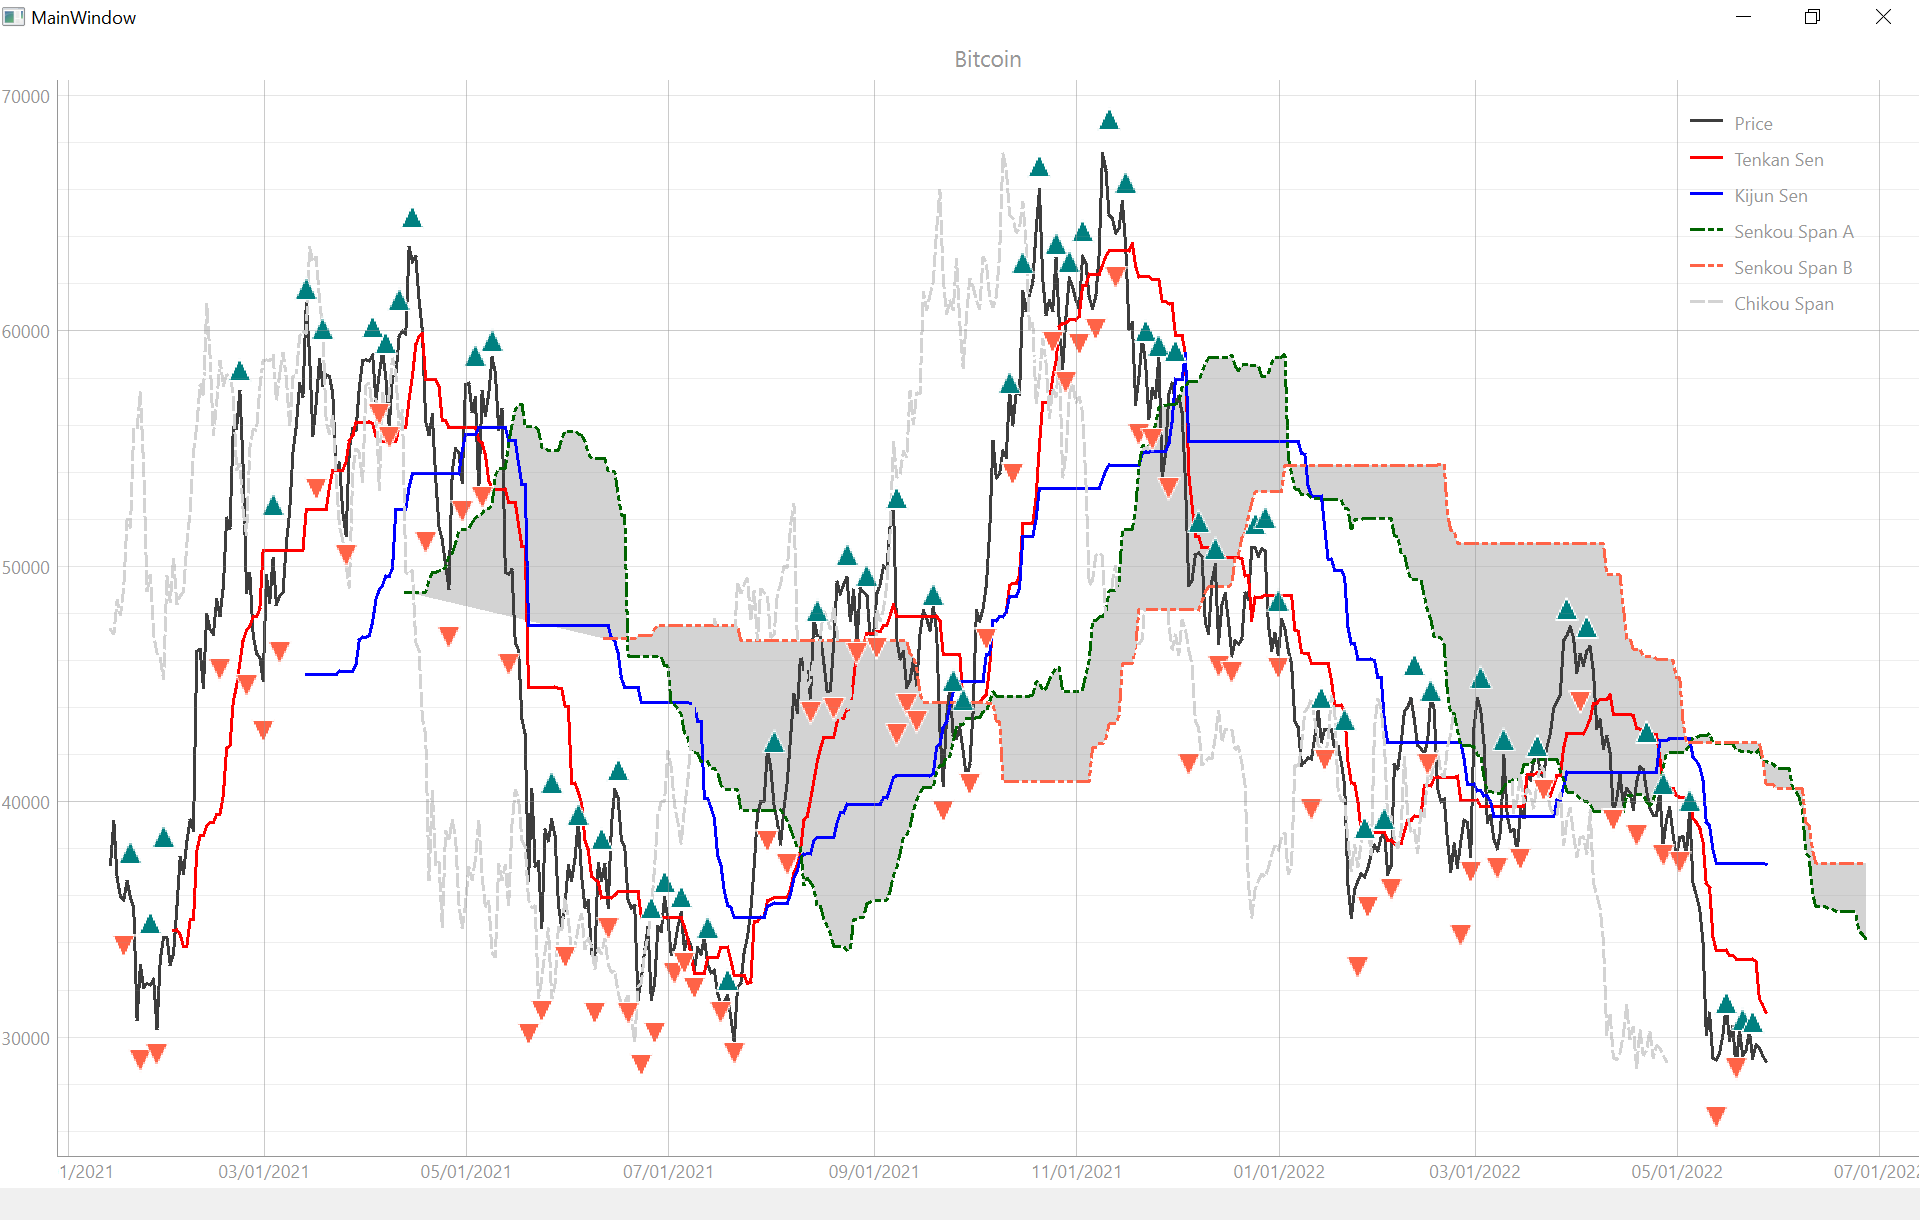 You can see the dates have been fixed in the picture above.
In order to fix how the dates are displayed at the bottom of the chart we need to add one more file into the program. Name this file dateaxis.py and create it next to main.py in the root directory of the crypto directory.
Projects/crypto/
├─ analysis/
│  ├─ __init__.py
│  ├─ ichimoku.py
│  └─ williams.py
├─ binance/
│  ├─ __init__.py
│  ├─ api.py
│  ├─ binance.py
│  └─ market.py
├─ crypto.ui
├─ dateaxis.py
├─ main.py
└─ ui_crypto.py
Change the code in main to the following
import sys

from PySide6.QtWidgets import QApplication, QMainWindow, QDialog
from ui_crypto         import Ui_MainWindow
from PySide6.QtCore    import Qt

from binance.binance   import Binance
from analysis.williams import Fractals
from analysis.ichimoku import IchimokuKinkoHyo

from dateaxis          import DateAxisItem

import pyqtgraph as pg

def main():
    app = QApplication(sys.argv)
    app.setStyle('Fusion')
    window = MainWindow()
    window.show()
    app.exec()

class MainWindow(QMainWindow, Ui_MainWindow):
    def __init__(self, *args, **kwargs):
        super().__init__(*args, **kwargs)
        self.setupUi(self)

        # Repair Dates
        date_axis        = DateAxisItem(orientation='bottom')
        self.graphWidget = pg.PlotWidget(axisItems = {'bottom': date_axis})
        self.setCentralWidget(self.graphWidget)

        # Style
        self.graphWidget.setBackground('w')

        # Title
        self.graphWidget.setTitle("Bitcoin")

        # Legend
        self.graphWidget.addLegend()

        # Grid
        self.graphWidget.showGrid(x=True, y=True)

        # Plot Bitcoin
        bi = Binance()
        df = bi.candles(
            symbol   = "BTCUSDT",
            interval = "1d"
        )

        dates = df.index.to_pydatetime()
        dates = [i.timestamp() for i in dates]

        price = pg.mkPen(color="#3d3d3d", width=3, style=Qt.SolidLine)
        self.graphWidget.plot(dates, df["close"], name="Price", pen=price)

        # Plot Technicals
        IchimokuKinkoHyo().plot_qt(df, self.graphWidget, pg, Qt)
        Fractals().plot_qt_f(df, self.graphWidget, pg, Qt)

if __name__ == "__main__":
    main()
Copy the following code into the new dateaxis.py file.
from pyqtgraph import AxisItem
from datetime  import datetime

class DateAxisItem(AxisItem):

    def tickStrings(self, values, scale, spacing):
        ret = []
        if not values:
            return []

        if spacing >= 31622400:
            fmt = "%Y"

        elif spacing >= 2678400:
            fmt = "%m/%d/%Y"

        elif spacing >= 86400:
            fmt = "%b/%d"

        elif spacing >= 3600:
            fmt = "%b/%d-%Hh"

        elif spacing >= 60:
            fmt = "%H:%M"

        elif spacing >= 1:
            fmt = "%H:%M:%S"

        else:
            fmt = '[+%fms]'

        for x in values:
            try:
                t = datetime.fromtimestamp(x)
                ret.append(t.strftime(fmt))
            except ValueError:
                ret.append('')

        return ret
Conclusion & Attributions
The Bitcoin & Dogecoin icons used in the original picture at the top of the article were created by Freepik and downloaded from flaticon.com, the Ethereum icon was created by tulpahn and the candlestick icon was created by Zulkifly Suradin.